
Forex Trading: Unlock Your Profit Potential with MetaTrader 4 & 5 Think about a New York real estate hustler pocketing $10,000 after months of flipping a fixer-upper, or a Miami sports bettor scoring $50,000 on a Super Bowl parlay. Now picture trading currencies from your laptop, banking profits in hours—without dealing with contractors or relying on game-day luck. Forex trading, with its non-stop markets and massive $7 trillion daily liquidity, is a serious opportunity for anyone looking to build real income. MetaTrader 4 and 5, built by MetaQuotes Software, are your tools to get in the game, offering clean charts, automated trading, and sharp data analysis. This guide walks you through setting up and fine-tuning MetaTrader 4 and 5, showing how a solid setup lets you tap into Forex’s potential with precision and control. “My buddy Jake, a software developer with a remote tech job, was always tinkering with code in his spare time. He got hooked on building trading algorithms for MetaTrader 4, spending months testing them on historical data until he nailed a solid strategy. Now, his Forex portfolio’s profits dwarf his tech salary, turning his coding hobby into a serious income stream.” Anonymous client story. DAAVFX Why MetaTrader Runs the Show MetaTrader 4 and 5 aren’t just popular—they’re the gold standard for Forex trading. Since 2005, MT4’s been the go-to for its straightforward design and ability to handle automated trading systems, perfect for currency traders. MT5 steps up with access to stocks, futures, and other markets, ideal for those branching out. Both deliver top-notch charting, customizable layouts, and backtesting to test your strategies without losing cash. Your trading goals decide which one’s right. Stick with MT4 if you’re all about currencies and automation. Go for MT5 if you want more markets or deeper data tools. Either way, you need a broker who’s got your back. VT Markets, for example, offers tight spreads and fast trades, making it a solid pick for MetaTrader users. Want to know why brokers are a big deal? Check this guide on Forex brokers. “When I got into Forex in 2019, I was just figuring things out. I noticed MT4 had a huge community and tons of free or cracked EAs, so it made sense to go with the most popular platform. That choice got me trading currencies fast, with plenty of support to lean on.” Why Backtesting Gives You an Edge MetaTrader’s backtesting feature is a game-changer, letting you test trading plans against past market data before risking a cent. Both MT4 and MT5 include the Strategy Tester, a free tool that puts professional-grade analysis in your hands. Whether you trade manually or use automated systems, backtesting shows if your approach can actually make money. How Backtesting Works The Strategy Tester runs fake trades using historical data, so you can see how a plan would’ve performed over months or years. Manual traders can check buy-and-sell rules against old market moves. Automated traders can tweak their algorithms, digging into stats like profits, losses, or profit factor. MT5’s got an edge here, using multiple CPU cores to blast through complex tests faster—great for testing multiple markets or detailed strategies. Here’s the deal: MT4 uses one CPU core, which is fine for simple currency trades. MT5 taps multiple cores to handle bigger data or run tests side by side, cutting down wait times. A test that takes hours on MT4 might be done in minutes on MT5, depending on your computer. In favor of MT4, the community and content spans decades, so it remains a solid option to consider! Free Data That Packs a Punch Backtesting’s even better because it’s free. MetaTrader & connected brokers give you historical data—ticks (small price changes) and bars (price summaries over time, like hourly charts)—without charging a dime. In an industry where data feeds can cost thousands, that’s a steal. The data’s legit, especially for major currency pairs, detailed enough to mimic real trading conditions. MT5 offers finer tick data and custom timeframes, perfect for fast-paced strategies. But it depends on your broker’s feed. Solid brokers like VT Markets usually deliver reliable data, though you should double-check for niche markets like exotic currencies or stocks, which might have gaps. “Back in my early trading days, I struggled to keep my strategies profitable. Then I leaned into MT4’s Strategy Tester, constantly refining my algorithms and manual trades with backtesting across tons of data sets in minutes. This reduced my timing and gave me an edge most real-time traders can’t touch, boosting my results big time.” – DAAVILE Why It Matters Free backtesting tools like these are a big deal. Most platforms charge a fortune for this kind of power, but MetaTrader hands it to you for nothing. That’s a lifeline for regular traders or anyone building automated systems on a budget. Testing with solid data helps you dodge costly mistakes, giving you a real shot at steady income. For best results, make sure your computer can handle MT5’s multi-core demands. If you’re running automated systems 24/7, a Virtual Private Server (VPS) keeps things smooth—check out this budget-friendly VPS option. Always compare backtest results to live markets, since real-time factors like price slips can change things. Nail the Strategy Tester, and you’ve got a serious edge. Step-by-Step: Setting Up MetaTrader Getting MetaTrader 4 or 5 on your computer is quick, but you’ve got to do it right. Here’s how to set it up without a hitch. 1️⃣ Pick Your Platform Head to your broker’s download page for MT4 or MT5—VT Markets has these in their platform section. Grab the installer for your system (Windows or Mac). Not sure which platform? MT4’s great for currency trading and automation; MT5 handles more markets. Check VT Markets’ guides for MT4 accounts or MT5 accounts for details. MetaTrader 4 Download MetaTrader 5 Download 2️⃣ Install the Software Find the installer in your downloads folder, run it, and follow the prompts. Stick with the default save location or pick your own spot. It takes about

VT MARKETS Account types – MT5 Forex Broker
MetaTrader 5 (MT5) Account Types – Full Breakdown 🚀 MetaTrader 5 (MT5) Account Types – Full Breakdown MetaTrader 5 (MT5) is the next-generation platform after MT4—faster, more flexible, and packed with advanced features. While the account types remain the same (Standard, Cent, Swap-Free, PAMM), MT5 gives traders extra tools to enhance their decision-making and overall trading experience. 🆚 MT4 vs. MT5: What’s Different? Feature MT4 MT5 Trading Instruments Mostly Forex & CFDs Forex, CFDs, stocks, futures, crypto Timeframes 9 timeframes 21 timeframes Order Types 4 6 (includes stop-limit orders) Economic Calendar ❌ ✅ Built-in Strategy Tester Single-threaded Multi-threaded & supports EAs Hedging ✅ ✅ (plus netting option) 🔹 Choosing the Right MT5 Account Type ✅ Standard/STP Account – MT5 ✔ Direct market access via STP (no dealing desk) ✔ Fast trade execution with real-time pricing ✔ Access to stocks, indices, and crypto ✔ More indicators and advanced charting tools ✅ Standard/STP Swap-Free (Islamic) – MT5 ✔ No overnight swap interest ✔ All benefits of Standard STP ✔ Built-in analytics and multi-asset support ✔ Perfect for long-term trading ✅ Cent STP Account – MT5 🌟 Best for strategy testing + small capital ✔ Trade with micro capital (e.g., $10 = 1,000 cents) ✔ Full access to MT5’s advanced charting ✔ Great for testing EAs or learning with real money ✅ Cent STP Swap-Free Account (Islamic) – MT5 ✔ Swap-free micro-trading setup ✔ Ethical trading compliance with full analytics ✔ Ideal for testing or long-term strategies ✅ PAMM Investor Account – MT5 ✔ Hands-off investing with professional traders ✔ Transparency through MT5 reporting tools ✔ Multi-manager portfolio allocation ✔ Diversified asset growth opportunities 🔗 Use My Affiliate Link When Registering To get started, click the link below to register with VT Markets: 🌟 CLICK HERE TO OPEN YOUR VT MARKETS ACCOUNT Why use this link? ✔ Your account is registered under my referral (ID: 7251856) ✔ You get direct support from me, including setup help and access to my tools ✔ The broker doesn’t retain your commissions unnecessarily ✅ GET MY SYSTEM TODAY! https://daavile.com/pricing/ ✅ YOU NEED A VPS? GET THE ONE I USE FOR BEST PRICE-VALUE! https://portal.forexcheapvps.com/aff.php?aff=3134 How to open cent account 🔗 Use My Affiliate Link When Registering To get started, click the link below to register with VT Markets: 🌟 CLICK HERE TO OPEN YOUR VT MARKETS ACCOUNT Why use this link? ✔ Your account is registered under my referral (ID: 7251856) ✔ You get direct support from me, including setup help and access to my tools ✔ The broker doesn’t retain your commissions unnecessarily ✅ GET MY SYSTEM TODAY! https://daavile.com/pricing/ ✅ YOU NEED A VPS? GET THE ONE I USE FOR BEST PRICE-VALUE! https://portal.forexcheapvps.com/aff.php?aff=3134
VT MARKETS Account types – MT4 Forex Broker
🚀 MetaTrader 4 (MT4) Account Types MT4 is a globally trusted platform offering flexibility, reliability, and a range of account types designed to suit every kind of trader—from absolute beginners to seasoned pros. Let’s explore the main account types, what they offer, and who they’re best for. 🚀 MetaTrader 4 (MT4) Account Types MetaTrader 4 (MT4) is a globally trusted platform offering flexibility, reliability, and a range of account types designed to suit every kind of trader—from absolute beginners to seasoned pros. 🔹 Standard/STP Account This account gives traders direct market access via Straight Through Processing (STP)—an efficient, transparent route to the market. Key Advantages: ✔ Market execution with tight spreads ✔ Real trading environment with no dealing desk ✔ Great for traders using manual or automated strategies ✔ No commission (usually built into spreads) Is this for me? Perfect if you’re ready to trade standard lot sizes and want direct, reliable access to the markets with professional-level execution. 🔹 Standard/STP Swap-Free (Islamic) Account This is the Sharia-compliant version of the Standard STP account. It removes overnight swap interest to respect Islamic finance principles. Key Advantages: ✔ All benefits of a Standard STP account ✔ No interest or swap charges ✔ Great for holding positions long-term without added costs Is this for me? Ideal for traders who follow Islamic finance principles or anyone looking to avoid swap charges. 🔹 Cent STP Account 🌟 Highly Recommended for Small Capital or Stress Testing Cent accounts are an incredible tool for those starting small or testing strategies under live conditions—with minimal risk. Key Advantages: ✔ Deposit as little as $1 and start trading ✔ All balances and trades are shown in cents (e.g., $10 = 1,000¢) ✔ Real market trading conditions with micro exposure ✔ Ideal for testing Expert Advisors (EAs) and manual strategies ✔ Stress-test setups without risking big capital ✔ Full STP execution – just like standard accounts Is this for me? Yes—if you’re: ✔ New to trading and want to practice with real money, not demo ✔ Working with a small budget and want lower exposure ✔ Testing a new strategy or EA and need live-market performance without large risk 🔹 Cent STP Swap-Free Account (Islamic) This is the best of both worlds—Cent account flexibility with swap-free benefits for those who trade in line with Islamic finance. Key Advantages: ✔ Micro-level exposure with cent-based balance ✔ No interest charges on overnight positions ✔ Ideal for long-term testing or Sharia-compliant micro trading ✔ Full STP execution and real-market feel 🔹 PAMM Investor Account PAMM (Percentage Allocation Management Module) accounts are hands-off investment solutions where professional traders manage your funds. Key Advantages: ✔ Passive income potential—let experts trade for you ✔ Transparent performance metrics and rankings ✔ Diversify your trading by following multiple managers ✔ Profits (and losses) are shared proportionally Is this for me? Yes—if you prefer a passive role in trading, want to grow your capital without actively managing trades, or wish to diversify by investing in multiple experienced traders. 💡 Final Word: Why Cent Accounts Deserve More Love Cent accounts are underrated power tools in forex. They allow: ✔ Real trading with minimal capital ✔ Less emotional pressure due to lower monetary exposure ✔ Easier performance tracking of new strategies and EAs ✔ Great learning experience in live conditions, unlike demo accounts Whether you’re starting out or stress-testing a new setup, Cent STP accounts on MT4 give you all the market realism with none of the financial overwhelm. How to open cent account 🔗 Use My Affiliate Link When Registering To get started, click the link below to register with VT Markets: 🌟 CLICK HERE TO OPEN YOUR VT MARKETS ACCOUNT Why use this link? ✔ Your account is registered under my referral (ID: 7251856) ✔ You get direct support from me, including setup help and access to my tools ✔ The broker doesn’t retain your commissions unnecessarily ✅ GET MY SYSTEM TODAY! https://daavile.com/pricing/ ✅ YOU NEED A VPS? GET THE ONE I USE FOR BEST PRICE-VALUE! https://portal.forexcheapvps.com/aff.php?aff=3134

How to open trading account with VT markets
Open a Trading Account with VT Markets How to Open a Trading Account with VT Markets (MT4, MT5 & Demo) Once you’ve registered your VT Markets account, the next step is to open a trading account—this is where you’ll execute trades using MetaTrader 4 (MT4) or MetaTrader 5 (MT5). 📌 What You’ll Learn: Differences between MT4, MT5, and demo accounts Understanding leverage (up to 1:500) Step-by-step account setup in VT Markets 🧠 What Is a Trading Account? Your VT Markets account serves as your main dashboard login, but you need individual trading accounts under it: Live accounts for real-money trading Demo accounts for risk-free practice 🖥️ MT4 vs. MT5: Which Platform Is Best? 🔹 MetaTrader 4 (MT4) Best for forex bots and automated trading Supports most Expert Advisors (EAs) Recommended for algorithmic traders 🔹 MetaTrader 5 (MT5) Includes stocks, futures, and commodities Modern interface with more tools Best for multi-asset trading ✅ For forex bots, MT4 remains the best choice. ⚖️ Understanding Leverage (Up to 1:500) Leverage allows you to trade larger positions than your actual balance. Example: If you deposit $100 with 1:500 leverage, you can control $50,000 in the market. While this amplifies profits, it also increases risk. Use leverage wisely, especially with automated strategies. 🔧 How to Open a Trading Account Inside VT Markets Log in to your VT Markets dashboard: VT Markets Login Select MT4, MT5, or Demo Set your leverage and deposit funds Start trading! 🚀 How to Open a Trading Account in VT Markets Follow these steps after logging into your VT Markets dashboard: Go to the “Account” tab in the left-hand menu Click “Open Live Account” or “Open Demo Account” You will now see the Account Configuration form. 📝 Fill in the Account Configuration Form Here’s what you’ll need to set up: ➤ Choose trading platform Select MT4 (recommended for my bot) Or choose MT5 if you prefer ➤ Choose account type Options include Standard, Raw ECN, Cent (we’ll cover types later) ➤ Choose account currency USD, EUR, etc. (most use USD) ➤ Create a password for the account Set a secure password for this specific trading account If you don’t set a password, VT Markets will auto-generate one and send it to your email ➤ Additional notes (optional) You can leave this blank or add any comments for internal tracking 📩 Final Step: Submit & Check Your Email Once you click Submit, your trading account will be created. VT Markets will send the following details to your registered email: Login number (account ID) Server details Account password (if auto-generated) You can now use these credentials to log in to your MT4 or MT5 platform and start trading — or connect your trading bot. 🔗 Use My Affiliate Link When Registering To get started, use the following link to register with VT Markets: 🌟 Open Your VT Markets Account Here Why use this link? Using my affiliate link ensures that broker commissions are not retained unnecessarily. It also helps me continue providing support, updates, and access to my strategy and bot tools at no extra cost to you. ✅ GET MY SYSTEM TODAY! ✅ YOU NEED A VPS? GET THE ONE I USE FOR BEST PRICE-VALUE!

How to open account with VT markets Forex Broker
🚀 Start Trading: Open Your VT Markets Account Today Opening an account with VT Markets takes just a few minutes and gives you access to the trading platform where you can use my bot and strategy system. This guide walks you through how to register a real account (not a trading account yet) using my affiliate ID, ensuring that broker commissions aren’t retained and that I can provide full support to help you set up properly. ✅ Step 1: Go to the Official VT Markets Registration Page Click the link below to begin your registration: 🌟 CLICK HERE TO OPEN YOUR VT MARKETS ACCOUNT Why use this link? ✔ Your account is registered under my referral (ID: 7251856) ✔ You get direct support from me, including setup help and access to my tools ✔ The broker doesn’t retain your commissions unnecessarily SPANISH / ENGLISH How to Open an Account with VT Markets (Step-by-Step Guide) 📌 How to Open an Account with VT Markets (Step-by-Step Guide) Opening an account with VT Markets takes just a few minutes and gives you access to the trading platform where you can use my bot and strategy system. This guide walks you through how to register a real account (not a trading account yet) using my affiliate ID, so that broker commissions aren’t retained and I can support you properly. 🚫 Restrictions – Who Can Register VT Markets does not accept clients from the United States or Venezuela unless you have a passport from another accepted country. If you’re from either of those countries but have a second nationality, you can still register — just choose that country during sign-up. Note: Registration is required to confirm broker availability in your country. If you encounter any issues, contact DAAVILE at support@daavile.com—we have solutions for every client! 📝 Step 2: Fill Out the Registration Form Once you’re on the page, you’ll need to complete the following fields: Country of Residence – Select your country (example: Mexico) Email – Enter your valid email address Password – Must be 8–16 characters and include: At least 1 uppercase letter (A–Z) At least 1 lowercase letter (a–z) At least 1 number (0–9) At least 1 special character (!@#$%^&*.()) Referral (optional) – Enter this ID: 7251856 to ensure your account is linked to my system. Check the box confirming you’re not a U.S. resident. After that, click “Open a Real Account” to continue. 📧 Step 3: Confirm Your Email VT Markets will send you a confirmation email. Open it and click the link to activate your account. 🆔 Step 4: Upload Documents for Verification You’ll need to upload: A copy of your passport or national ID A proof of address (bank statement or utility bill) Once approved, your account will be fully active and ready to open trading accounts. ✅ You’re Done – Next Steps After your main account is verified, you’ll be able to: Open trading accounts (MT4, MT5, or cent accounts) Make your first deposit Connect to my bot and trading strategy service Send me your VT Markets account email or ID after registration so I can confirm your setup. 🔗 Use My Affiliate Link When Registering To get started, use the following link to register with VT Markets: 🌟 Open Your VT Markets Account Here Why use this link? ✔ Your account is registered under my referral (ID: 7251856) ✔ You get direct support from me, including setup help and access to my tools ✔ The broker doesn’t retain your commissions unnecessarily ✅ GET MY SYSTEM TODAY! https://daavile.com/pricing/ ✅ YOU NEED A VPS? GET THE ONE I USE FOR BEST PRICE-VALUE! https://portal.forexcheapvps.com/aff.php?aff=3134

Forex Brokers 101: Why You Need One to Trade
Forex Brokers Explained: Why You Need One to Trade Forex Brokers Explained: What They Are and Why You Need One to Start Trading ✅ What Is a Forex Broker? A forex broker is a financial services company that provides access to a trading platform for buying and selling foreign currencies. Simply put, you can’t trade forex without a broker — they connect you to the global currency markets. Whether you’re just starting out or planning to use a forex bot or automated strategy, choosing the right broker is crucial. The broker determines your spreads, trade execution speed, access to platforms like MetaTrader 4 (MT4) and MT5, and how easily your funds can move. 💡 Why Do You Need a Forex Broker? Forex brokers provide all the essential tools and infrastructure to trade effectively. A reliable broker will give you: ✅ A user-friendly trading platform ✅ Access to live market data and trade execution ✅ Leverage, allowing more market exposure with less capital ✅ Support for Expert Advisors (EAs) and trading bots ✅ Secure deposit and withdrawal methods ✅ Bonuses and trading incentives 🤖 If You’re Using a Trading Bot or Algo System — Your Broker Matters Not all brokers are optimized for automated trading. If you’re using my forex bot or strategy service, you need a broker that offers: ⚡ Low-latency execution to reduce slippage 🔧 Seamless EA compatibility on MT4/MT5 💰 Low spreads and commission for cost-efficient trading 📉 Fast execution during high-volatility market conditions 🔁 24/5 uptime for uninterrupted algorithm performance That’s why I recommend VT Markets for all my clients. It supports automation flawlessly and provides all the features needed to run my trading system smoothly. 🌍 What to Look for in a Forex Broker Before choosing a broker, here are the key features to consider: Feature Why It Matters Regulation Protects your funds and ensures ethical practices MT4/MT5 Support Required for running EAs or automated strategies Low Spreads & Fast Execution Essential for scalping or high-frequency strategies Cent or Demo Accounts Great for testing before going live Bonus Offers Boosts your initial trading capital Reliable Deposit/Withdrawal Options Fast access to your funds Support Get help when issues arise Choosing the Right Forex Broker 📌 Choosing the Right Forex Broker Forex brokers are not one-size-fits-all. The best choice depends on your trading style, market limitations, and platform preference. Different brokers offer support for various platforms, including: ⚡ NinjaTrader – Ideal for advanced charting and futures trading. 📊 cTrader – Known for transparent pricing and fast trade execution. 📈 TradingView – Perfect for traders who rely on interactive charting tools. 🏦 Proprietary Platforms – Custom-built platforms tailored for specific brokerage services. Ultimately, selecting a broker comes down to your individual trading goals, whether you’re using automation, scalping, or manual strategies. Consider regulation, spreads, execution speed, and platform compatibility before making a decision. Why I Recommend VT Markets for Forex Trading 🏦 Why I Recommend VT Markets After testing many brokers with my forex bot and strategies, VT Markets consistently performs best. It offers: ✅ Fast and stable execution on MT4 and MT5 ✅ Low spreads and excellent conditions for algo trading ✅ Cent account support for testing strategies with lower risk ✅ 100% and 20% deposit bonuses ✅ Multiple funding methods ✅ Regulated and globally trusted 🔗 Use My Affiliate Link When Registering To get started, use the following link to register with VT Markets: 🌟 Open Your VT Markets Account Here Why use this link? Using my affiliate link ensures that broker commissions are not retained unnecessarily. It also helps me continue providing support, updates, and access to my strategy and bot tools at no extra cost to you. ✅ GET MY SYSTEM TODAY! https://daavile.com/pricing/ ✅ YOU NEED A VPS? GET THE ONE I USE FOR BEST PRICE-VALUE! https://portal.forexcheapvps.com/aff.php?aff=3134 📌 Final Thoughts Choosing a reliable forex broker is the foundation of a successful trading experience, especially if you’re using automated strategies. I personally use and recommend VT Markets for all my clients — it’s fast, trustworthy, and built for serious traders using EAs or bots.

XAUUSD GOLD Investing Portfolios: Securing Profits Amid Global Uncertainty
Market Conditions: XAUUSD GOLD Investing The global financial landscape has faced unprecedented turbulence over the past few years. From the COVID-19 pandemic to wars, banking collapses, crypto scams, and inflation spikes, investors have had to adapt quickly to maintain profitability while navigating extreme uncertainty. Traditional investment models have struggled to keep up with rapid market fluctuations. But for traders who understand volatility, this era presents exceptional opportunities—provided they use smart strategies and well-calculated risks. In this climate, achieving a +29% return is well above the market average. But what if we could push even further? How Global Events Are Reshaping Trading Strategies The post-pandemic world has redefined market dynamics, forcing traders to rethink their approach. Old models no longer work, and data-driven, adaptive trading systems are now essential for staying ahead. Some of the most disruptive financial events affecting today’s markets include: Trade wars & economic restrictions: Lingering effects of Trump-era tariffs and ongoing U.S.-China tensions disrupting global supply chains. War-related financial instability: Global conflicts triggering sanctions, rising energy prices, and unpredictable economic shifts. Bank collapses & financial crises: Institutions like SVB and Credit Suisse suffered liquidity crises, shaking investor confidence. Cryptocurrency scams & failures: The FTX collapse and fraudulent DeFi projects exposing the fragility of speculative assets. Inflation & economic uncertainty: Central banks battling inflation through interest rate hikes, affecting investment strategies. These events have reshaped how trading models must operate. Aggressive, high-frequency trading is riskier than ever, while structured risk management techniques hold the key to profitable investing. Trading Strategy: Why Only Buy Models in 2025? Why Only Buy Models in Early 2025? The DAAVILE FX ALGORITHM is built on buy-and-sell-specific strategies, avoiding generic, overfitted models that collapse under changing market conditions. Gold (XAUUSD) follows a pattern where selling typically carries significantly more risk than buying. As a safe-haven asset, gold trends upward during periods of instability, making buy strategies inherently safer than sell models. While selling gold can be profitable in certain conditions, it requires extensive optimization to avoid sudden market reversals. To protect clients and ensure maximum portfolio value, sell models have been temporarily removed to allow for the analysis of fresh 2025 market data, refining execution strategies, and delivering the best possible results. For early 2025, we are releasing only buy models—a calculated move based on historical data, macroeconomic factors, and real-time risk management insights. This ensures that clients trade under the safest possible conditions, leveraging gold’s natural price movement trends while minimizing exposure to unpredictable reversals. Algorithm Optimization: Maximizing Trading Efficiency Making Every Trade Count with Constant Optimization Unlike conventional trading strategies that prioritize frequent activity over precision, the DAAVILE FX ALGORITHM is designed to maximize returns efficiently—ensuring that every trade is executed strategically, rather than simply for the sake of trading. This system is not static. Constant strategy optimization and code updates are integrated with new market data, ensuring that only the best-performing models remain active and profitable. Rather than relying on outdated algorithms or overfitted strategies that fail when market conditions shift, this model evolves with fresh data—adapting to volatility, global economic events, and emerging trends. By continuously refining execution logic, integrating real-time market insights, and adapting to new economic conditions, the DAAVILE FX ALGORITHM ensures that your money works smarter, not harder—always targeting the most profitable trades with the lowest risk exposure. Ready to Tap into Passive Income? The industry is full of distractions—fake gurus, overpriced courses, and signal providers who profit when you lose. We cut through the noise with tested, proven strategies designed for consistency and growth. Visit www.daavile.com and start growing your wealth the smart way.
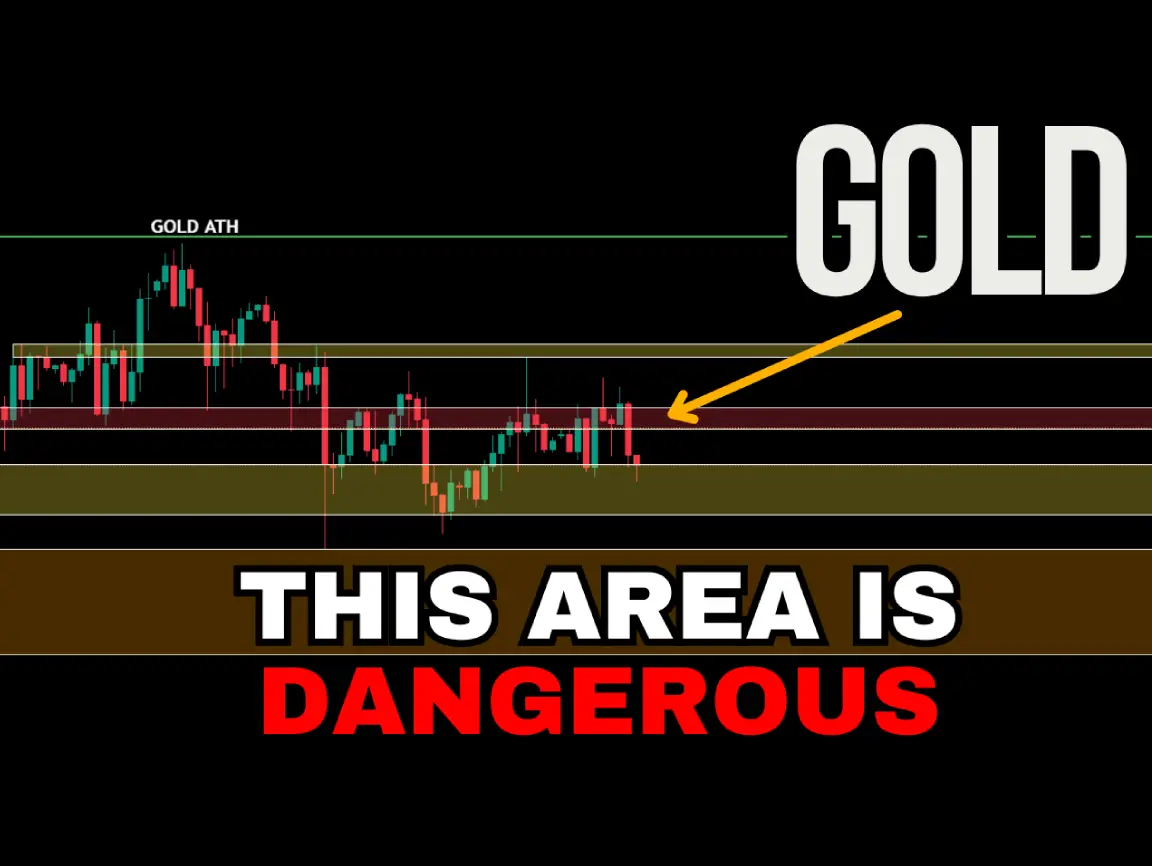
XAUUSD UPDATE PRE GDP RELEASE – AVOID DANGER & OVERLEVERAGING!
https://youtu.be/c0N2bGvqf6Q Currently, price is providing mixed sentiment in an area full of liquidity, and we are experiencing huge candles with big wicks, leaving tons of market inefficiencies. It is very dangerous to trade these zones if you don’t have a deep understanding of how these moves work. It’s better to keep positions, entries, or even stop losses far from this area. These zones are not valid ranges since we have previously rejected them multiple times, either acting as support or resistance. It is important to note that we are in new territories—price has never been this high in history—and we are trading based on what the market delivers in real time. We, as traders, need to adapt and react. Trying to predict will set your account balance to zero by positioning yourself in zones that have huge liquidity-grab potential. Unless you are a trained scalper or are using hedge algorithms, this red area from $3,026 – $3,017 is acting as a huge magnet for stop-loss hunts, and price is only preparing for tomorrow’s news. GDP has tons of potential to deliver an insane move, and you should not waste any chance of trading it! If you mark your charts and position yourself with enough margin and correct sizing, you will benefit from any move. Price will move on both sides, and you have, at least, a 50/50 chance of making it. Myself? I’m a hedge, no stop-loss trader, so I’m definitely milking both sides of the move! XAUUSD Pre-GDP Breakdown! 🔑 Levels: $3,027-$3,056 📊 Market structure + tech insights 💡 Get ready for the move! 👉 Check out the full breakdown here!

XAUUSD Pre-GDP Analysis: Market Structure and Technical Insights
Technical and Fundamental Support for Bullish Gold Thesis Every technical and fundamental aspect continues to support our bullish thesis. This is easy to understand when viewing GOLD as a real asset with intrinsic value. Investors avoid uncertain assets with high supply during times of low demand. However, smart investors never stay too far away; opportunities arise when the market stops paying attention. Gold as the Ultimate Safe-Haven Asset Gold has always been the go-to asset when markets become volatile and uncertain. Currently priced at $3,022 per ounce, XAUUSD’s recent movements illustrate the push-and-pull between economic uncertainty and recovery. As global and U.S. indicators fluctuate, gold traders are presented with unique opportunities to profit from safe-haven demand and volatility. Current Gold Price Gold’s Current Level: As of March 25, 2025, gold is trading at approximately $3,022 per ounce. Recent Economic Indicators and Their Impact on Gold Prices March 24, 2025: Flash Manufacturing PMI (USD): Contracted at 49.8, signaling weakness in manufacturing. Historically, such contractions support safe-haven assets like gold. Flash Services PMI (USD): Increased to 54.3, reflecting expansion in services. While this tempers gold’s appeal, cautious sentiment still prevails. President Trump’s Speech: Markets closely monitored geopolitical signals and policy updates that may influence XAUUSD sentiment. Check yesterday’s post for a detailed PMI breakdown: Gold Pullback Buy Opportunity: XAUUSD Trader’s Guide https://www.forexfactory.com/calendar March 25, 2025: S&P/CS Composite-20 HPI y/y (USD): The S&P/CS Composite-20 Housing Price Index tracks the year-over-year changes in housing prices across 20 major U.S. metropolitan areas. A higher index number indicates strength in the housing market, signaling economic resilience. Housing price index growth to 4.7% signals resilience, but with limited direct influence on gold prices. Richmond Manufacturing Index (USD): This index measures overall manufacturing activity within the Richmond Federal Reserve district. A reading of -4 indicates contraction, highlighting challenges such as reduced demand or production in the manufacturing sector. Dropped significantly to -4, indicating manufacturing weakness, lending further support to gold demand. CB Consumer Confidence (USD): This index reflects the degree of optimism consumers have about the health of the economy and their financial conditions. A decline to 92.9 suggests waning sentiment, signaling economic uncertainty. Declined to 92.9, illustrating waning sentiment, a potential driver of safe-haven flows into gold. New Home Sales (USD): This metric tracks the number of newly constructed homes sold in the U.S., reflecting housing market health and broader economic activity. An increase to 676K indicates positive momentum. Increased to 676K, showing economic activity but with muted gold price impact. Technical Analysis and Market Sentiment March 24 Movement: XAUUSD traded between $3,013.76 and $3,033.32, closing at $3,018-ish. March 25 Level: Approximately $3,022.13 as of now. Indicators: Mixed sentiment—with strong consolidation in bullish key levels and fundamentals supporting a bullish move. Short-Term Projections: Potential climb to $3,030.24 within 24 hours, while a medium-term outlook points to a drop towards $2,994.33 over the next week. Price Range: Gold futures traded between $3,024-$3,038 as of March 24, significantly above the 50-day SMA ($2,847.60) and 100-day SMA ($2,761.80), reinforcing a strong uptrend. Key Levels: Resistance: $3,026-$3,038. Support: $3,022-$3,005. Economic Context: GDP, Unemployment, and Inflation GDP and Jobs Data: The U.S. economy’s growth rate has been revised downward to 1.7% for 2025 and 1.6% for 2026. February job gains (151,000 vs. expected 160,000) signal cooling growth, with unemployment rising to 4.1%. Recession concerns remain high, driving demand for gold as a safe-haven asset. Inflationary Pressures: Tariff implementations have weakened the U.S. dollar, enhancing gold’s appeal as an inflation hedge. The Federal Reserve’s announcement of potential rate cuts by year-end further strengthens gold demand, as lower rates reduce the opportunity cost of holding non-yielding assets like gold. Market Outlook Geopolitical Factors: U.S. tariff policies and ongoing trade uncertainties are fueling demand for safe-haven assets like gold. As tensions escalate, gold remains a favored choice for investors seeking stability. Central Bank Moves: Emerging market central banks continue to increase their gold reserves, providing strong underlying support for gold prices. This trend of ramping up reserves reflects a shift toward safeguarding against economic instability. Projections: Analysts foresee further upward movement in gold prices, with the potential to reach new all-time highs if current economic trends and geopolitical factors persist.

Gold Pullback or Buy Opportunity? What XAU/USD Traders Need to Know Now
Gold (XAU/USD) Pullback: Healthy Discount Meets Bearish Sentiment Gold (XAU/USD) has been retracing, offering a healthy discount for potential buyers, while short positions continue rejecting critical areas. The persistent formation of lower highs underscores a strong bearish structure in the short term, reflecting a market still grappling with mixed sentiment. Adding to this uncertainty, the latest Purchasing Managers’ Index (PMI) data reveals a mixed economic outlook for the U.S., influencing both gold and the dollar. What is PMI and Why Does It Matter? The Purchasing Managers’ Index (PMI) is a key economic indicator that reflects the health of specific sectors within the economy. It is derived from surveys of purchasing managers in manufacturing and services industries, focusing on metrics like: New Orders Inventory Levels Production Supplier Deliveries Employment This index is split into two main components: Manufacturing PMI: This measures the performance of the manufacturing sector. A reading above 50 indicates expansion. A reading below 50 signals contraction. The recent figure of 49.8 indicates contraction, suggesting slowing industrial output. This could weaken the USD and support gold as a safe-haven asset. Services PMI: This tracks the performance of the services sector, which includes industries like finance, healthcare, and retail. A reading above 50 indicates growth. The latest figure of 54.3 shows continued expansion, highlighting strong consumer demand and service-related activity. This can bolster the USD, as it reflects economic stability. Together, these PMIs provide a snapshot of economic momentum, influencing market sentiment and asset prices like gold and the USD. Key Technical Levels From a technical perspective, several critical levels are shaping the current market: $3,026 – A Strong Rejection Zone: Price has consistently shown rejection in the $3,026 area, forming a robust resistance level. Sellers have dominated here, preventing upward momentum. $3,022 – A Key Liquidity Area: The $3,022 level was previously broken with a strong wick, indicating significant liquidity. This makes it a prime area for a possible retest, particularly if bulls regain control and attempt to break resistance. $3,000 – A Magnet for Liquidity: Price appears to be chasing the $3,000 zone, where a pool of liquidity remains after the last bullish cycle. Although price touched this level briefly, the rejection was swift and lacked the depth to qualify as a solid retest. A return to this zone could pave the way for a more meaningful reaction. Why the Bearish Move Despite Mixed Data? The current bearish momentum in gold, despite mixed PMI data, could be interpreted as a strategic move by institutional players. Here’s why: Discount for Institutional Buying: Institutions often use temporary price dips to accumulate positions at lower levels. The retracement in gold, combined with key liquidity zones at $3,000 and $3,022, suggests preparation for a larger bullish push. Fundamental Support for Gold: Economic slowdown concerns, geopolitical risks, and dovish central bank policies continue to favor gold in the long term. These factors suggest that the bearish move may be temporary, setting the stage for a renewed drive toward new all-time highs. Market Manipulation for Liquidity: The bearish structure could be a calculated effort to shake out retail traders and collect liquidity. Once this phase completes, a strong recovery aligning with gold’s bullish fundamentals is likely. Recent News and Analysis (March 22–March 24, 2025) Gold (XAU/USD) and the US Dollar (USD) have been on a wild ride over the past few days, driven by economic data, Fed moves, and global tensions. Here’s what’s been happening from March 22 to March 24, 2025, at 09:06 AM CST, and why prices are shifting: Gold Price Movements Gold hit a record high of $3,056.20 on March 23, 2025, before pulling back to the $3,030 region. The retreat came as the US Dollar strengthened and US yields dipped, with investors digesting the Fed’s latest hawkish-leaning pause—rates steady at 4.25%-4.5%—but still expecting cuts later in 2025. Weekly analysis from Daily Forex pegged gold’s gain at 1.19% last week, calling dips a buy due to safe-haven demand from trade wars and geopolitical risks. By March 24, gold stabilized near $3,030-$3,050, with technicals hinting the correction might be done—support at $3,027, resistance at $3,056 and up. The Flash PMI data at 7:45 AM CST—Manufacturing at 49.8 (contraction) vs. Services at 54.3 (expansion)—adds a twist: weak manufacturing could lift gold, but strong services might prop the USD. USD Movements The US Dollar Index (DXY) spiked briefly on March 23 after the Fed’s hawkish tone, then softened as Wall Street clawed back losses. Trade war fears with China and the EU dragged sentiment, but solid unemployment claims and manufacturing surveys gave short-term USD support—though weak retail sales tempered it. On March 24, lower USD volatility is predicted, with Core PCE and GDP data later in the week potentially shifting momentum. Today’s PMI split adds mixed signals to USD sentiment. Key Drivers Geopolitical Risks: Trade war tensions and global unrest keep gold’s safe-haven bid alive while denting the USD’s outlook. Federal Reserve Policy: Rate cuts often signal economic weakness or easing inflation—conditions in which gold thrives. However, a “soft landing” scenario (economic growth with no panic) could stabilize or strengthen the USD, potentially limiting gold’s upside. Historical Evidence: Past post-recession rate cuts (e.g., 2008–2011) show gold losing momentum if fear fades and confidence in the economy returns. Why Bullish Here Timing: These are expected cuts for late 2025, not now—markets are front-running. Gold’s $3,030–$3,056 range (Mar 24) rides safe-haven vibes (trade wars, PMI split) plus anticipation of a weaker USD later. USD Pressure: Cuts signal looser policy—USD softens long-term (DXY eased Mar 23), making gold cheaper for non-US buyers. Geopolitical Kicker: Trade tensions and PMI’s 49.8 manufacturing flop (Mar 24) keep gold bid as a hedge, overriding pure rate-cut logic. Economic Data: March 24 PMI—49.8 Manufacturing, 54.3 Services—shows a split economy, hinting at gold upside if slowdown fears grow. Technicals: Gold’s $3,027 support and $3,056–$3,070 resistance are key; USD’s range-bound. Extra Juice (March 22–23) March 22: Gold hovered near $3,038, pre-Fed jitters, with tariff fears pushing safe-haven flows. March 23: Citi’s call—gold to
