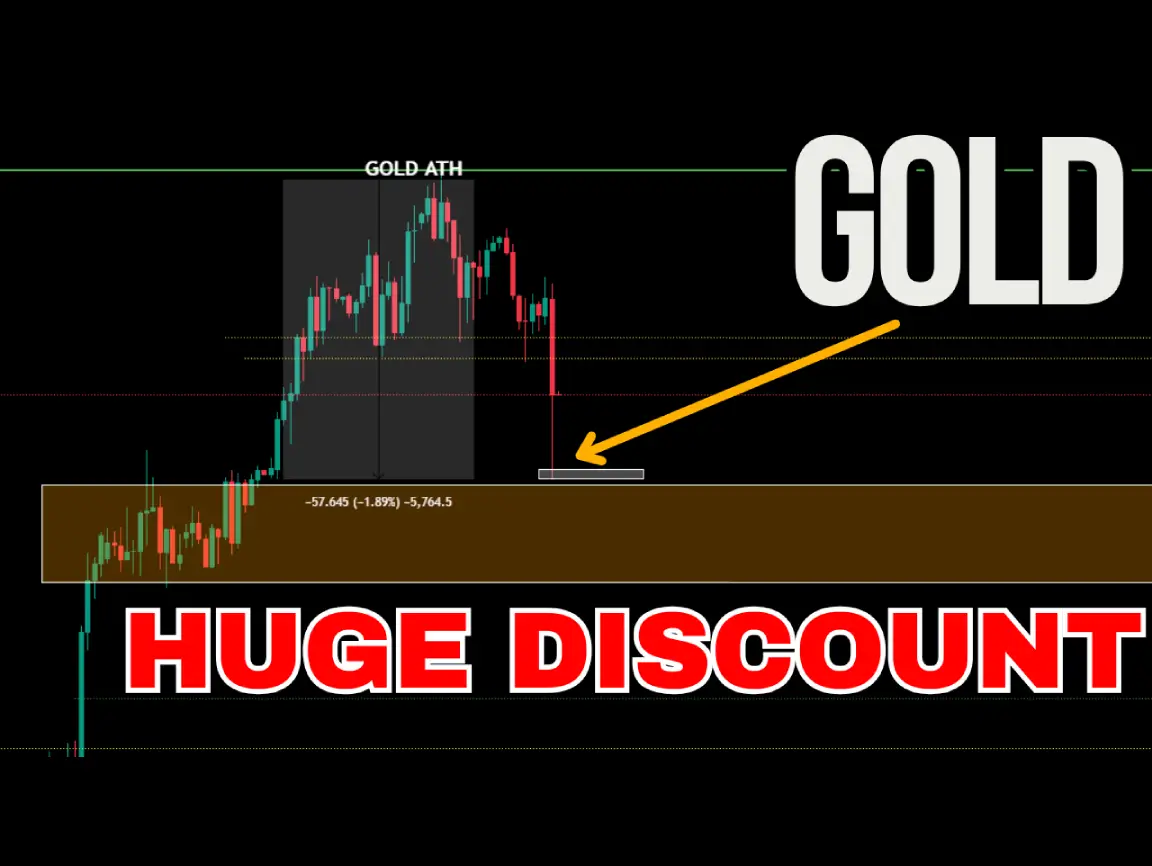
Gold (XAUUSD): Healthy Pullback After ATHs A Healthy Pullback After ATHs Gold (XAUUSD) finally gave traders a breather with a solid retracement, stepping back after printing multiple all-time highs (ATHs) between sessions. This wasn’t a random dip—price action respected our pre-mapped market zones, handing out take-profit (TP) levels or fresh entry points for those who played it smart. If you sized your margin and lots right, this move was a goldmine—literally. Zones Deliver, Precision Pays The retracement didn’t just tease—it delivered. Our algo-driven zones, stress-tested over 118 weeks (like my +147% run in 2021–2024), held firm, offering clean exits or entries. Whether you’re riding the bullish wave or scalping the dip, positioning was key. Big players don’t sleep on these levels—they’re hunting the same edges. Did you catch the move, or are you still chasing? Big News Looms Next Week Hold tight—next week’s stacked with market movers: GDP data, unemployment claims, and more. The last piece drops end of week, so don’t get caught flat-footed in no-man’s-land. Bias stays bullish—XAUUSD’s got legs—but the smart money’s eyeing a discount before pushing for new ATHs. Think $3,000+ is crazy? Watch the big dogs; they’re loading up. Live Results Incoming Want proof this works? Stay tuned for this week’s live trading results—raw, no fluff. My algo’s been bagging wins (think $23k in a day), and I’ll break it down. From zones to execution, it’s all here. #XAUUSD traders, this is your edge—don’t sleep on it.
Live Algo Trading with XAU/USD: Maximize Profits on Gold Movements
Gold (XAU/USD): Strong Bullish Momentum with Key Market Insights Gold (XAU/USD): Strong Bullish Momentum with Key Market Insights This week, the market presented its final relevant data, leaving gold in a robust and bullish position. The decision to keep interest rates flat, paired with Powell’s mixed signals during his remarks, has created uncertainty around the US dollar’s short-term trajectory. With these factors at play, the outlook for the dollar remains dim in the immediate term, and all eyes are now on next week’s critical GDP data and unemployment claims for further direction. For traders, this environment demands strategic positioning. Ensuring efficient use of margin becomes essential to withstand potentially large price movements and avoid unnecessary liquidation risk. While gold maintains a bullish outlook supported by strong technical analysis (TA) and favorable fundamentals, traders should remain agile as the market offers opportunities on both sides of the chart. Ultimately, capitalizing on this period requires a balanced approach that navigates the bullish case for gold while recognizing the volatility and dynamics presented by broader macroeconomic conditions. https://youtu.be/N_NOnYap7tA TRADESTING: 100% Automated Passive Income Revolution Trading & Investing Are Outdated: TRADESTING – Your Key to 100% Automated Passive Income Revolutionize your income with this advanced system that works 24/7 to make you money. TRADESTING is designed to deliver automated trading solutions, allowing you to earn passive income effortlessly in today’s fast-paced financial markets. Learn about the transformative benefits of algorithmic TRADESTING and how it can boost your profits while saving you time and effort. By leveraging cutting-edge algorithms and strategies, you can capitalize on the gold and forex markets without needing to monitor the charts constantly. Don’t miss out on this opportunity to take your financial journey to the next level. Position yourself at the forefront of innovation and let TRADESTING handle the heavy lifting. It’s time to enjoy automated success! Enjoy the journey and subscribe for more insights and updates!

Daavile FX: Proven Algorithmic Trading Strategies That Outperformed Hedge Funds and Banks 2021-2024
Home Services System Blog Contact Us Home Services System Blog Contact Us My Results Get System XAUUSD ALGORITHMIC TRADING BOT IS TESTED & OPTIMIZED SINCE 2019 I Built an Algo That Crushed It Doing Nothing Pushing My Algo to the Edge: Stress Testing for Results Testing the Limits F1 drivers push max speed to know the car; I pushed my algo to know the edge. From 2021 to 2024, before I even considered selling or pitching anything, I opened a portfolio and let my algo run it—100% automatic, no touching it. The whole point was to test it hard, see if the strategy and code could stand up. I trade on stats, not chances. My only risk? A trend that never stops, no dips. That’s it. Why Gold (XAU) and USD? Data’s on my side. I picked gold (XAU) and the U.S. dollar (USD)—the big dogs. Tons of info shows markets move in waves, always pulling back. Those retracements? That’s where I win. The Importance of Margin The max stress kicks in when my margin hits zero. Margin’s the fuel—it’s what lets the account and algo open trades. Picture a broker giving you room for 500 to 1,000 trades, up to 1,000 lots at once. As a grid trader, I’ve got margin mastery and higher experience than most. When it hits zero, trades end. That’s what I watch. Grid Trading: Smarter Strategies for Extreme Market Trends Why Drawdowns Don’t Shake Me Drawdowns (DD) don’t shake me—they’re normal. I’m not here to guess where the market’s going. I trade what it’s doing. Say gold jumps $50 in a day. A newbie might panic, slap a stop loss, and eat a loss. Stop losses are lazy—straight-line risk control that cuts you out early. I don’t use them, because I don’t need them, my skill is beyond gurus risk management.. Grid Trading with Progressions Instead, I run grid trading with progressions. It’s sharper. One trade at one price? That’s leaving money on the table. Grid spreads trades across levels—say, buying at $1,900, $1,910, $1,920—and steps up the size as it moves. Cash stays active, not parked. When the price swings back, we close by averaging. 2024: Extreme Trends, Consistent Retracements In 2024, trends were extreme, but retracements remained consistent. For instance, gold climbed from $1,900 to $2,050. Instead of buying, I implemented a grid-style selling strategy at levels like $1,940, $1,980, and $2,020. When the price peaked and retraced by 30% to my average sell price of $1,980, I closed all trades in profit—averaging the initial ones from $1,900 with a positive exit overall. This consistent exit strategy demonstrates the system’s reliability. Backtesting EA Backtesting EA Backtesting EA Adapting to Drawdowns: Modern Trading Strategies for Maximum Efficiency Efficiency Through Drawdowns As trends extend, drawdown (DD) increases, but so does the system’s efficiency: average prices decrease, and profit potential grows. Unlike linear stop-loss methods, which require the market to surpass the entry price to generate profit, my approach adapts dynamically to market conditions. Traditional methods are outdated; this strategy leverages modern systems for more effective trading. DD as a Signal, Not a Setback Embracing DD isn’t reckless—it’s how I keep my algo in sync. It’s my signal, telling the EA what the trend is, right now, 100% of the time. No guesswork, just data. Refining the System: Hedge Triggers and Multi-Engine Strategies Refining the System: Hedge Triggers and Multi-Engine Strategies Using Hedge Triggers for Precision I deploy a hedge trigger—simultaneous buy and sell order—to use drawdowns (DD) as a precise indicator of the current trend. It’s designed to counter-trend: if gold rises from $1,900 to $2,050, the sell builds as the buy holds positive range, pinpointing the trend with 100% accuracy via DD. This isn’t about probabilities; it trains the algo to adapt to any market condition, using a simple but effective concept. I don’t care about sniper entries; I care about closing positive and making money long term. From V1 to V3: Continuous Improvement Version 1 ran two logics—a limited, single-track approach. V2 expanded to seven, adding more flexibility. Now, V3 operates three engines, each with seven logics—21 distinct trading strategies in total. It’s like having 21 expert traders working simultaneously, each with their own tactics, styles, and risk profiles—not just analyzing but actively executing. Results That Speak for Themselves With Portfolio 1, I aimed for aggressive compounding, allowing profits to grow rapidly. The results? +147% total, averaging 70% annually. I simply coded the system, applied it to a chart, and let it run. The risk peaked at 30% of the balance at one point—a calculated result of the aggressive compounding during testing. It wasn’t an accident; I pushed the system to its limits to refine it further. Critics demand perfection, yet V1 alone outperformed the S&P 500, which averaged below 20% yearly from 2021 to 2024, while I hit 70% with zero intervention. That’s the key metric: outstanding returns with minimal effort. Algorithmic Trading: Stress Testing and Adapting with V3 Algorithmic Trading: Stress Testing and Adapting with V3 Addressing Drawdowns with Data-Driven Efficiency The 30% drawdown came from prolonged trends overwhelming V1’s simpler logic. Using that data, V3 now adjusts effortlessly, combining historical and current inputs for peak efficiency. Those years were turbulent—Russia-Ukraine conflict, bank failures, the FTX collapse, rate fluctuations. Hedge funds posted losses, the S&P 500 went negative in 2022, and banks struggled or failed. My high DD? It was part of the stress test under crisis conditions—not a weakness. Many overlook this when seeking consistency. Why V3 Thrives Under Tough Conditions This system thrives under these conditions: higher risk drives greater recovery. With the V3 system, I precisely tailor risk based on each client’s specific tolerance, goals, and expectations. Using the extensive data and insights from V1, I deliver tangible optimization backed by proven results—not empty promises. I don’t rely on outdated, linear stop-loss methods. Instead, I leverage the invaluable experience gained from market conditions where so-called “pros” faced repeated losses, ensuring

TRADESTING: Your Key to 100% Automated Passive Income Trading & Investing Are Outdated
Trading & Investing Are Outdated: TRADESTING – Revolutionizing Income Trading & Investing Are Outdated: TRADESTING – Your Key to 100% Automated Passive Income Revolutionize your income with this advanced system that works 24/7 to make you money. Learn about the benefits of algorithmic TRADESTING and how it can boost your profits in the financial markets. Algorithmic trading, often dubbed “algo trading,” leverages computer programs to execute trades based on predefined rules, operating at speeds and frequencies beyond human capability. According to a 2019 study, approximately 92% of trading in the Forex market was driven by algorithms, showcasing their dominance in modern finance. TRADESTING takes this a step further, offering a fully automated system designed for passive income, eliminating the need for constant manual oversight. As algorithmic traders, we have the chance to deliver insane results backed by data and driven by advanced strategies. The global algorithmic trading market was valued at USD 21.06 billion in 2024 and is projected to grow at a compound annual growth rate (CAGR) of 12.9% through 2030, fueled by advancements in AI and machine learning. These technologies enable systems like DAAVILE FX to analyze vast datasets in real-time, identifying profitable opportunities that traditional traders might miss. TRADESTING: Advanced Strategies for Consistent Profits TRADESTING: Advanced Strategies for Consistent Profits I find it interesting how limited some systems are or how gurus feel entitled to have the last word. Traditional trading strategies often rely on rigid frameworks—like fixed stop losses or trend predictions—that fail to adapt to market volatility. Meanwhile, self-proclaimed experts peddle outdated methods, profiting more from course sales than actual trading. The disconnect is stark: retail traders are taught to fear losses, while advanced algo systems thrive by embracing market dynamics. I’m able to profit consistently from markets using whatever they are afraid of doing: My DAAVILEFX Strategies Under the TRADESTING Concept NO stop loss -> Trailing is miles ahead and more advanced. Traditional stop losses lock in losses prematurely, often triggered by short-term market noise. Trailing stops, by contrast, dynamically adjust to price movements, allowing profits to run while still managing risk. Research shows that trailing mechanisms, when paired with algorithmic execution, can enhance profitability by adapting to trends rather than cutting them short. DAAVILEFX’s approach capitalizes on this, prioritizing flexibility over rigid loss caps. Counter trending -> Predicting = gambling. I don’t gamble. Counter-trend strategies exploit price corrections rather than chasing momentum, a tactic often avoided by retail traders due to its perceived risk. Yet, data from quantitative trading studies highlights that counter-trending can outperform in range-bound markets—common in forex and crypto—where prices oscillate rather than trend indefinitely. By avoiding predictive gambling, DAAVILEFX focuses on reacting to real-time data, a hallmark of robust algo systems. Grid -> It is 100 times better to diversify 1 lot in X trend. Grid trading involves placing multiple buy and sell orders at set intervals, creating a “grid” that profits from market fluctuations within a range. Unlike single-entry strategies that hinge on one price point, grid trading diversifies risk across multiple levels. Platforms like Pionex have popularized this method in crypto markets, with users reporting consistent gains in volatile conditions. DAAVILEFX’s grid approach amplifies this by automating execution, ensuring no opportunity is missed. Smart progressions -> Multipliers don’t mean martingale champs. While martingale strategies double down on losses—a risky spiral—smart progressions use controlled multipliers to scale positions strategically. Combined with grid trading, this diversifies margin allocation, reducing exposure to single-point failures. Backtesting data suggests that such hybrid strategies can stabilize returns, especially in high-frequency trading environments where DAAVILEFX operates. Hedging -> Forex volatility demands it. I also use hedging since this market’s volatility and the nature of forex assets won’t deliver prolonged trends or prices going to zero like in stocks. Hedging protects against adverse moves in forex’s oscillating conditions, balancing risk while maintaining profit potential. DAAVILEFX integrates this to adapt to the unique dynamics of forex trading. Just the basic sauce I use daily with my systems, and it has profited for me since 2021 with consistent results. Consistency is key in algo trading, where systems like DAAVILEFX can execute thousands of trades annually, far surpassing the capacity of manual traders. TRADESTING vs. Investing and Manual Trading TRADESTING vs. Investing and Manual Trading Investing is slow and boring. Better buy bonds and enjoy life. Trading is high risk with huge potential—not suited for everyone. Traditional investing, like buying and holding stocks or bonds, yields average annual returns of 7-10% (e.g., S&P 500 historical average), often too slow for those seeking rapid wealth growth. Manual trading, while offering higher potential, demands constant attention and carries significant risk—over 70% of day traders lose money, per studies. DAAVILEFX, under the TRADESTING concept, bridges this gap, automating high-potential trades for passive income without the grind. Algo trading can achieve insane, consistent results retail traders won’t believe, thanks to the lies spread by gurus trying to sell courses. The retail trading narrative—pushed by influencers—is steeped in oversimplified tactics like “set a stop loss and pray.” Yet, high-frequency trading (HFT) firms, which account for over 50% of U.S. equity volume, rely on sophisticated algorithms, not guru platitudes. DAAVILEFX embodies this edge, debunking myths with data-driven performance. It is easier to set a stop loss and blame the market while selling you a course; you will take 1 year to learn, and once you figure out the edge is useless, the guru will blame you by posting some fake results. Classic in the industry. This cycle is pervasive: gurus profit from hope, not results. A 2023 survey found that 80% of trading course buyers felt misled by exaggerated claims. DAAVILEFX sidesteps this trap, offering a tangible, automated solution that doesn’t rely on human hype—just code, data, and execution. https://youtu.be/_bjUbvVFWVc
Trading & Investing Are Outdated: TRADESTING – Your Key to 100% Automated Passive Income
Revolutionize your income with this advanced system that works 24/7 to make you money. Learn about the benefits of algorithmic TRADESTING and how it can boost your profits in the financial markets. Don’t miss out on this opportunity to take your money to the next level!

Gold Smashes $3,000: What’s Happening and Why It Matters
Gold Smashes $3,000: What’s Happening and Why It Matters On March 14, 2025, gold (XAUUSD) did something huge—it blasted past $3,000 per ounce, hitting a record $3,004.86 during trading. By the end of the day, it settled at $2,991.00 per ounce, still a massive leap. This wasn’t some random spike; it’s the result of a wild mix of economic chaos, central banks hoarding gold like it’s the last lifeboat, and a world that feels like it’s teetering on edge. Here’s the breakdown of what went down, why it happened, and what might come next. Price and Performance: The Numbers Tell the Story The buildup was intense. On March 13, 2025, gold jumped 1.6% to $2,979.76 per ounce, so close to $3,000 you could feel the tension in the trading pits. Then, boom—March 14 hit, and gold charged through that psychological barrier. Reuters clocked the peak at $3,004.86, with trading volume surging as investors rushed in. Settling at $2,991.00 still marked a historic close. This year’s been a gold rush already—up 14% in 2025 so far, riding the wave of a 27% gain in 2024. Compare that to stocks or bonds, and it’s clear gold’s been the star of the show. Back in 2011, it peaked at $1,921 per ounce during the European debt mess—big, but today’s rally dwarfs it. The market’s alive, and gold’s leading the charge. Driving Factors: What Lit the Fuse? Economic Uncertainty: Trump’s back in the White House, slapping tariffs on steel, aluminum, and electronics. Global trade’s wobbling—China and Europe pushed back, growth slowed, and investors bolted for gold. It’s the classic safe-haven play when the world feels shaky. Central Banks Going Hard: These guys aren’t messing around. In 2024, they scooped up 414 tonnes of gold, after 1,136 tonnes in 2022 and over 1,000 tonnes in 2023. China’s been stacking reserves like it’s prepping for something big, and India added 8 tonnes just in November 2024. That’s not pocket change—it’s a signal gold’s a bedrock asset. Fed Moves: Rate cuts from the Federal Reserve tanked the U.S. dollar. When the dollar’s weak, gold gets cheap for foreign buyers and shines as an inflation shield. Simple math, big impact. Geopolitical Mess: Eastern Europe’s a hotspot, Asia’s trade fights are heating up, and uncertainty’s the name of the game. Gold thrives when trust in everything else fades. ETF inflows hit a four-year high in Q1 2025—$2.3 billion poured in, per the World Gold Council. Economic Data Context: The Week of March 9-15, 2025 The week leading up to gold’s historic surge was marked by a series of economic data releases that painted a complex picture of the U.S. economy, amplifying the uncertainty that drove investors toward safe-haven assets like gold. Here’s how the data unfolded: Economic Data Context: The Week of March 9-15, 2025 This mix of data—cooling inflation, a strong labor market, declining consumer confidence, and rising inflation expectations—created a volatile economic backdrop. Investors, uncertain about the Federal Reserve’s next moves and wary of broader economic and policy risks (like Trump’s tariffs), likely turned to gold as a hedge against this uncertainty. Tuesday, March 11: JOLTS Job Openings: Reported at 7.74 million, exceeding the forecast of 7.65 million and up from the previous 7.51 million. This indicated a resilient labor market, suggesting economic strength that might influence Federal Reserve policy. Wednesday, March 12: Core CPI m/m: Rose by 0.2%, below the forecast of 0.3% and the previous 0.4%. This measure of underlying inflation hinted at cooling price pressures. CPI m/m: Also up by 0.2%, under the expected 0.3% and down from 0.5%, reinforcing the trend of moderating inflation. CPI y/y: Came in at 2.8%, below the forecast of 2.9% and the prior 3.0%, further suggesting inflation was easing. Thursday, March 13: Core PPI m/m: Declined by 0.1%, significantly below the forecast of 0.3% and the previous 0.5%, indicating reduced inflationary pressure at the wholesale level. PPI m/m: Flat at 0.0%, missing the expected 0.3% and down from 0.6%, aligning with the cooling inflation narrative. Unemployment Claims: Reported at 220K, better than the forecast of 226K and slightly below the previous 222K, signaling continued labor market strength. Friday, March 14: Prelim UoM Consumer Sentiment: Dropped to 57.9, well below the forecast of 63.1 and the prior 64.7, reflecting growing consumer pessimism on the very day gold broke $3,000. Prelim UoM Inflation Expectations: Jumped to 4.9% from 4.3%, suggesting that despite current cooling inflation, consumers anticipated higher prices ahead. Analyst Insights: What the Experts Say The pros are buzzing. Goldman Sachs upped their 2025 forecast to $3,100 per ounce on March 15, pointing to central bank buying and Fed easing. Their commodities head, John Smith, said, “This isn’t a fluke—it’s got staying power.” Allegiance Gold sees it trading between $3,000 and $3,200, betting on steady demand. Others are bolder. InvestingHaven calls for $3,275 by year-end, with a wild $5,155 by 2030. CoinPriceForecast predicts $3,474 in 2025. But there’s a flip side—some warn a stronger dollar or a Fed U-turn could stall it. Still, the bulls are loudest right now. Historical Context: Seen This Before? Gold’s got a track record for these moments. In 2011, it hit $1,921 amid debt fears, then dipped when things calmed down. Back in 2008, it broke $1,000 during the financial crash, pulled back, then climbed again. Today’s surge feels familiar—uncertainty, central bank moves—but the scale’s bigger. Those record purchases in 2022–2024 give it a solid floor. History says watch for volatility, though—gold loves a rollercoaster. Central Bank Demand: The Heavy Hitters Central banks are the muscle behind this rally. Beyond the 414 tonnes in 2024, the trend’s relentless—1,136 tonnes in 2022, over 1,000 tonnes in 2023. China’s been a beast, bulking up late last year, while India’s steady at it too. The World Gold Council says 81% of central banks expect global gold reserves to grow in the next year, with 29% planning their own buys. Why? It’s a hedge against dollar dominance and a buffer for shaky economies. This isn’t a fad—it’s

Gold Breaks All-Time High: XAUUSD Nears $3,000 as Inflation and PPI Drive Prices (VIDEO)
Why is the Gold Price Pumping? Gold prices hit new all-time highs on March 13, 2025, and here’s why: Global Demand Gold remains the go-to safe-haven asset during economic uncertainty. Strong market trends and expectations of further monetary easing, especially by the Federal Reserve, have amplified demand. Inflation Data US inflation slowed more than expected. The CPI dropped to 2.8% in February (forecast: 2.9%), and Core CPI fell to 3.1%, the lowest since April 2021. This supports the possibility of interest rate cuts, favoring gold. Weaker USD A weaker US dollar made gold more affordable internationally, driving up demand. Technical Breakouts Gold’s consistent moves above key resistance levels fueled additional buying pressure. Trade Tensions Ongoing trade disputes and tariff uncertainties encouraged investors to seek safe assets like gold. Current Price Level Gold’s price reached $2,972 today with significant volume, pushing toward the psychological level of $3,000. This aligns with weaker-than-expected Core PPI (-0.1% vs. 0.3% forecast) and flat PPI (0.0% vs. 0.3% forecast), signaling cooling price pressures. https://youtu.be/E-vaS14fGlQ
Gold Breaks All-Time High: XAUUSD Nears $3,000 as Inflation and PPI Drive Prices
Gold Breaks All-Time High: XAUUSD Nears $3,000 as Inflation and PPI Drive Prices After excellent news this week and possible macro issues cooling down, the currency market has been very active lately. CPI and PPI data might give the FED that extra push they needed for another rate cut during March. It is very important to note, the labor market overall has been stable all of 2025 with more good news this week per JOLTS and unemployment claims reducing. Today’s unemployment claims came in at 220K, better than the forecasted 226K and lower than the previous 222K, reinforcing the idea of a stable labor market. I cheer for this and the American citizen who were with the incognita if the new government and fed actions will benefit them or trigger a new 2008 catalyst. I don’t know about the new government; you have a six-times expert in bankruptcies being led by a parasite that can’t provide any sort of value to humanity, yet he calls himself a genius… fake and liar. The important thing, and what matters, is the USA is a big and complex country with solid institutions and divided interests. What those two monkeys want to do, is not 100% approved and the FED is one of them. Since 2021, I just hear low IQ monkeys talk trash to the fed and my lord Powell while they are just typing and not even placing trades or money where their mouth is. To all the paper traders and paper economists, it is good to remind, this is the first time in history we have a pandemic in modern times and the reason they printed money was due to the lockdown; this has nothing to do with the 2006-2011 cycle where human factors triggered the crisis. It’s really impressive how dumb and low IQ people are that don’t understand basic economics but want to ball big and talk like they own the place. They should be learning and start gathering data on what worked and what’s not; instead, they are typing that keyboard so hard on social media they are making money from ads. But you all know me, I make money trading and investing in the financial market; I put my mouth where my money is and I’m not scared of being wrong since this is all about learning and adapting and every new piece of data can only make me better compared to big ego personalities that will be limited forever. Why is the gold price pumping? Gold prices surged to new all-time highs on March 13, 2025, due to several key factors: Global Demand and Bullish Sentiment: Rising demand for gold as a safe-haven asset, coupled with strong global market trends, supported the price surge. This was driven by economic uncertainties and expectations of further monetary easing by central banks like the Federal Reserve. US Inflation Data: Cooler-than-expected US consumer inflation data reinforced the likelihood of interest rate cuts, reducing the opportunity cost of holding non-yielding assets like gold. The US inflation rate eased to 2.8% in February, below the forecast of 2.9%, and Core CPI also slowed to 3.1%, marking the lowest level since April 2021. Weaker US Dollar: A weaker dollar made gold cheaper for international buyers, increasing demand and boosting prices. Technical Factors: Gold broke key resistance levels, maintaining its upward trend and attracting further buying interest. Trade Uncertainty: Ongoing trade tensions and tariff uncertainties prompted increased safe-haven buying, as investors sought stability during volatile economic times. On that note, just as gold’s price action was gaining traction, it reached a new all-time high (ATH) with significant trading volume. The price is currently at $2,972 and pushing towards the key psychological level of $3,000. This aligns with today’s data showing Core PPI m/m at -0.1%, below the forecasted 0.3%, and PPI m/m flat at 0.0%, also below the forecasted 0.3%, indicating a possible easing of price pressures. That will be it for today, I will leave you with a quick XAUUSD breakdown since price action is very interesting and hot!
LIVE TRADING +$30,000 PROFITS DURING CPI – #XAUUSD ADVANCED ALGO TRADING DAAVILEFX
Live Trading: $30,000 Profits During CPI with Advanced Algo Trading Trading during the Consumer Price Index (CPI) release is no small feat, but with my V3 EA trading mode, I turned volatility into opportunity. Leveraging advanced algorithms, I navigated the market without using a stop loss and banked $30,000 in profits. How the V3 EA Trading Mode Works The V3 EA integrates several sophisticated techniques, including: Grid Trading: This method capitalizes on market movements, setting orders at strategic intervals to maximize gains. Hedge Trading: Designed to minimize risk, this strategy simultaneously balances potential losses and profits. Advanced Algorithms: Custom-coded logic ensures precision, adaptability, and efficiency in unpredictable conditions. Trading Insights During CPI With inflation and economic uncertainty dominating headlines, CPI releases can significantly impact market movements. My algo-driven approach thrives in these conditions, identifying patterns and executing trades in real-time. This session’s success underscores the importance of data-driven decision-making and the role of robust strategies in navigating high-volatility periods. Why This Strategy Stands Out Unlike traditional methods that rely heavily on stop-loss mechanisms, my approach focuses on flexibility. By incorporating grid and hedge trading, alongside advanced algorithms, the V3 EA adapts dynamically to market conditions, ensuring consistent profitability. Watch the Live Trading Session See the strategy in action and witness how I achieved these results during the CPI release: Discover more trading insights and strategies at DaavileFX. Stay ahead in the financial markets with advanced algo trading solutions. https://youtu.be/4i6pBdn2dUY
US Inflation Cools to 2.8% in March 2025—But Tariffs and Risks Could Heat Things Up
POST CPI GOLD CHART Price is finding huge resistance at $2,919 since yesterday, but the market was waiting for CPI to break the zone. With current data, the price does not have enough data to break the bullish structure or momentum. GOLD remains bullish per fundamentals and technicals. US Inflation Cools to 2.8% in February 2025—But Tariffs and Risks Could Heat Things Up What’s Happening With Inflation? Inflation makes groceries cost more or rent feel harder to manage. It’s been unpredictable lately, and March 2025 brought the latest update. As of March 12, prices rose just 2.8% over the year—a bit less than people expected. This article explains what this means for you, why things like tariffs could complicate it, and where the economy might go. You won’t need an economics degree to follow along. Whether you’re budgeting or just curious, it’s worth knowing. We’ll also share some easy-to-follow stats and personal examples. The Latest CPI Numbers: A Quick Look The Data Image 1: Consumer Price Index (CPI) for urban consumers, March 2024 to now. Yearly Increase: Prices rose 2.8% since last February. A dollar from 2024 now buys $1.028 worth. Analysts guessed 2.9%, and January showed 3.0%. (Source: BLS, March 12, 2025) Monthly Change: From January to February, prices rose 0.2%. Predictions were 0.3%, after a 0.5% rise last month. (Source: BLS) Core CPI: Excluding food and gas: Yearly: 3.1%, down from 3.3%, under the 3.2% prediction. Monthly: Up 0.2%, not the 0.3% analysts expected. (Source: BLS) What Stands Out Image 2: Monthly percent change in CPI for urban consumers (not adjusted), Feb 2024–Feb 2025. Prices aren’t climbing as fast as some thought. Groceries at home only rose 0.1% since May 2024, but eggs jumped 10.4% due to bird flu hitting farms. Travel costs, like flights and hotels, dropped 0.3%, likely due to winter storms. Rent is steady at 0.4%, thanks to more apartments being built. Coffee prices went up 1.2%, partly because of supply issues in Brazil. Wall Street’s Reaction The markets moved a bit. The dollar dropped from 105.60 to 104.90 before settling at 105.10 after the Fed gave vague comments. Bond yields (loan costs) fell from 4.15% to 4.08%. Bets on a rate cut in June jumped from 60% to 72%. This suggests cheaper loans could come soon. Why It Matters The Fed might take a break from raising rates. While egg and coffee prices hurt, steady rent helps balance things out. Inflation’s Journey Over the Last Year Here’s how prices have changed month by month since February 2024: Feb: 3.2% March: 3.5% (oil prices jumped with Ukraine’s issues) April: 3.4% May: 3.3% June: 3.0% July: 2.9% Aug: 2.5% Sept: 2.4% (Fed made big rate cuts) Oct: 2.6% Nov: 2.7% Dec: 2.9% Jan 2025: 3.0% (storms hit hard) Feb 2025: 2.8% US Inflation Cools, But Risks Remain US Inflation Cools, But Risks Remain Last March, oil prices jumped, pushing inflation to 3.5%. September saw 2.4% after the Fed cut rates. February’s 2.8% is near the Fed’s 2% target. January’s PCE, their key measure, was 2.4%. Spending is slowing, but supply issues continue. What’s Shaking the Economy? Tariff Threats Goldman Sachs says tariffs could raise borrowing costs and lower stock targets. Tariffs make things cost more. Comerica says a 10% tariff might push prices up 0.3-0.5% in a year. Some argue it will create factory jobs. Other Bumps in the Road January storms slowed early 2025 growth. Oil is $85 a barrel, and Middle East tension could raise prices. Market Vibes Stocks dropped to 5,528.41 on March 10, down 10% from December. This is due to tariffs and storms. Recession odds for late 2025 are 35%. Spending is still okay, despite the weather. By the Numbers Unemployment: 4.1% Jobs: 143,000 added in January Core PCE: 2.4% in January Tariffs are a risk. Oil and storms add to the problems. Jobs at 4.1% keep things stable. Where’s This All Headed? February’s 2.8% gives the Fed room to move. PCE is near 2%, and markets hope for a soft landing. Tariffs and oil could cause problems. Goldman sees prices up 0.4% by Q4 if tariffs hit 15%. Three Paths Ahead Most Likely (60%): Prices stay at 2.7-2.9% through 2025. Fed cuts rates 50 points. Stocks around 5,700. Tariff Trouble (30%): Prices climb to 3.2% by Q3. Fed holds off. Stocks drop to 5,300. Big Dip (10%): Spending falls. Prices drop to 2.2%. Fed cuts 75 points by December. What to Watch Fed’s March 19 meeting Tariff timing Oil hitting $90 Markets are nervous. CPI is a good sign, but tariffs and energy are risks. TD Securities thinks prices will ease to 3.0% by May. What We Thought Before the Drop Analysts expected prices at 2.9%, core at 3.2%. A drop below 2.9% would weaken the dollar and push rate-cut talks. The 2.8% changed the view from “prices are stuck” to “maybe they’re cooling.” Your Takeaway—and What’s Next February’s CPI dip to 2.8% is a small win. Prices aren’t rising fast, and the Fed might ease up. But tariffs, oil, and storms keep the future unclear. Your groceries, rent, and job? They’re all tied to this. Share your thoughts below.
