Gold (XAU/USD) and USA Economic Factors Explained 🎥 Real Traders Trade—Everyone Else Talks Check out my latest video where I break down the current gold (XAU/USD) price action and key USA economic factors influencing the markets. It’s all about action, not talk. https://youtu.be/rmUlPAozcSs

Gold Price Analysis: XAU/USD Trends and USA Economic Drivers for March 2025
Gold has been on an exciting ride lately. One day it dips, the next it bounces back stronger. It’s been keeping traders on their toes, and there are clear reasons behind the buzz. Gold took a hit yesterday, but it didn’t stay down for long. Buyers stepped in at key levels, pushing it back to around $2,900. From the charts, it seems poised to move higher—potentially even setting new records. Key Levels and Patterns Current Price: Gold is hovering around $2,900. If it breaks past $2,930, there’s a strong possibility of hitting $2,956 or even $2,970 setting new ATH. Support Levels: Key support lies at $2,860 and $2,829. 21-Day Moving Average: Gold is testing the 21-day moving average at $2,909, which serves as a pivotal level. RSI and Momentum: The Relative Strength Index (RSI) remains above 50, indicating strong buying interest. On the 4-hour chart, the RSI and a “Hammer reversal pattern” hint at continued bullish momentum. Technical Pattern: A “symmetrical triangle” has formed, signaling that gold could break in either direction. If volume supports a breakout, we might see a strong upward move. Gold is also trending within a “bullish channel.” While this typically indicates upward momentum, traders should remain cautious of potential corrections. The Power of Demand Zones The recent quick recovery wasn’t random. Gold dipped into a “demand zone,” where major buyers were waiting to step in. These zones are critical—they highlight where big money influences the market. Understanding these levels provides an edge in predicting market behavior. What’s Driving Gold? U.S. Economy at Play Jobs Data: The latest JOLTS Job Openings report showed higher-than-expected numbers, strengthening the U.S. dollar. A stronger dollar often pressures gold prices by making it more expensive for international buyers. Inflation Outlook: With inflation data due soon, markets are bracing for the Fed’s next move. If inflation remains high, the Fed might increase interest rates, supporting the dollar and potentially weakening gold. Fed Policy and Economic Data: Upcoming Fed meetings and retail sales reports could further impact gold. Positive data will likely bolster the dollar, adding pressure to gold prices. Gold’s Relationship with the Dollar Gold and the dollar typically move in opposite directions. When the dollar strengthens, gold tends to decline, and vice versa. Keep an eye on the Dollar Index as a leading indicator. Global Factors Supporting Gold Geopolitical Instability Events like the U.S.-Ukraine summit and global trade tensions are driving uncertainty. Historically, these factors boost gold’s appeal as a safe-haven asset. Economic challenges in major regions like China and the EU could further influence gold demand. Central Bank Activity Central banks are increasing their gold reserves, lending strong support to prices. Year-over-year purchases have been significant, especially from countries like China, Russia, and Turkey. Other Trends Gold ETF inflows are rising, signaling investor confidence in gold as a long-term hedge. Seasonal demand, particularly during Indian festivals, continues to push up gold prices. What Should Traders Do? Watch Critical Levels: Monitor the $2,930-20 resistance and $2,880 support/demand area to identify potential breakouts or reversals. Stay Updated: Follow key economic releases like inflation data, Fed decisions, and global events. These will shape the next big move in gold. Volume and Volatility: Pay close attention to volume spikes or increased volatility as they often precede major price movements. Diversify Analysis: Keep an eye on correlated commodities (e.g., silver, platinum) and currency pairs (e.g., AUD/USD) to gain additional insight. Gold’s journey is far from over. With economic data, geopolitical events, and technical patterns in focus, now is the time to stay alert and take advantage of the opportunities this dynamic market offers.
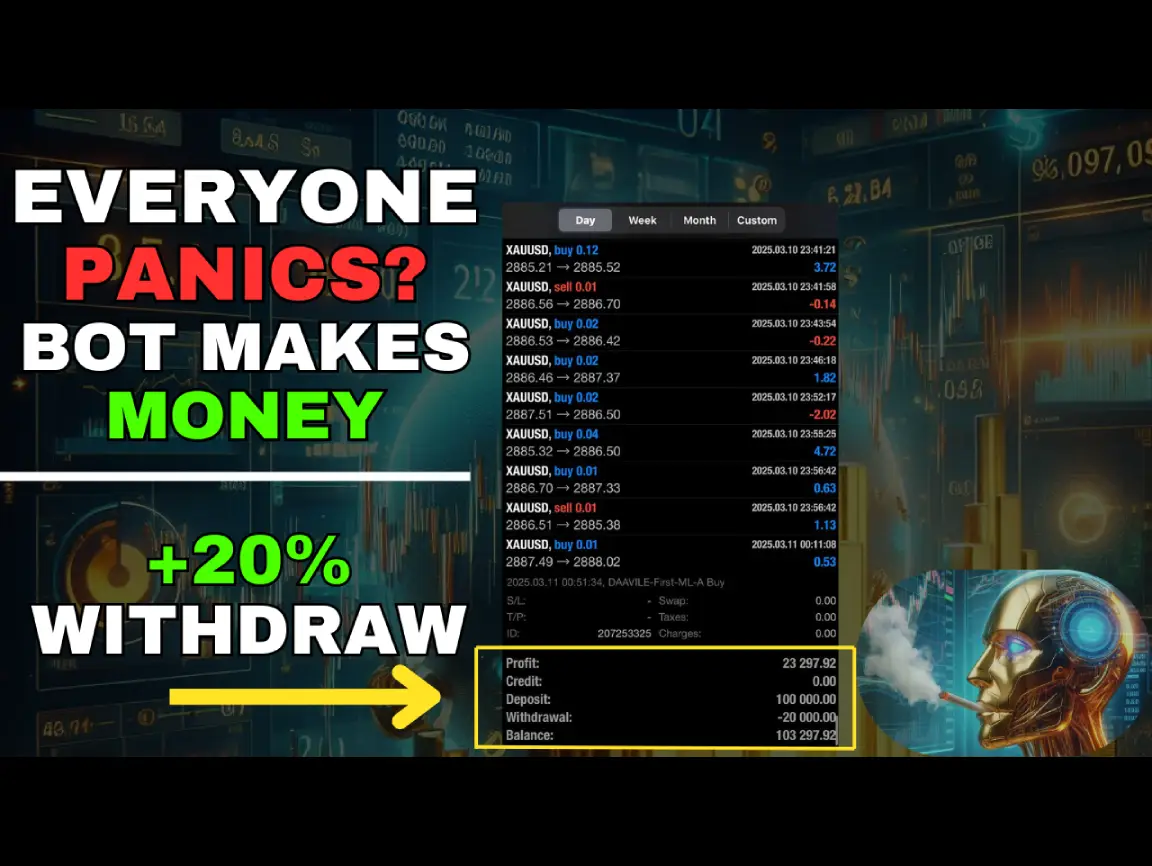
Live Algo Trading Bags $23,000 Profit in a Single Day—No Panic, Just Precision
Live Algo Trading Bags $23,000 Profit in a Single Day—No Panic, Just Precision While fear spread across the markets and traders struggled to react, I stayed calm, watching my bot work efficiently. The result? A $23,000 profit in one day, plus a 20% withdrawal to secure gains. This is the future of trading—where automation takes the stress out and focuses on results. During today’s market chaos, many traders were overwhelmed. My bot stayed on track, following a high risk-to-reward strategy and handling the situation smoothly. Here’s what makes it work: Optimized Risk-to-Reward: The bot finds the best opportunities and maximizes every trade. Consistent Precision: No emotions, no second-guessing—just actions based on data and strategy. Automation at Its Best: While people struggle, the bot sticks to the plan and delivers results. The outcome is clear: 23% profit in one day: Outperforming expectations with consistent performance. 20% withdrawal: Ensuring profits are locked in and managed smartly. While others stick to outdated, stressful methods, this bot shows there’s a better way. It’s not just about profits—it’s about creating a reliable system that works in any market condition. https://youtu.be/CZLSWf-WNCA
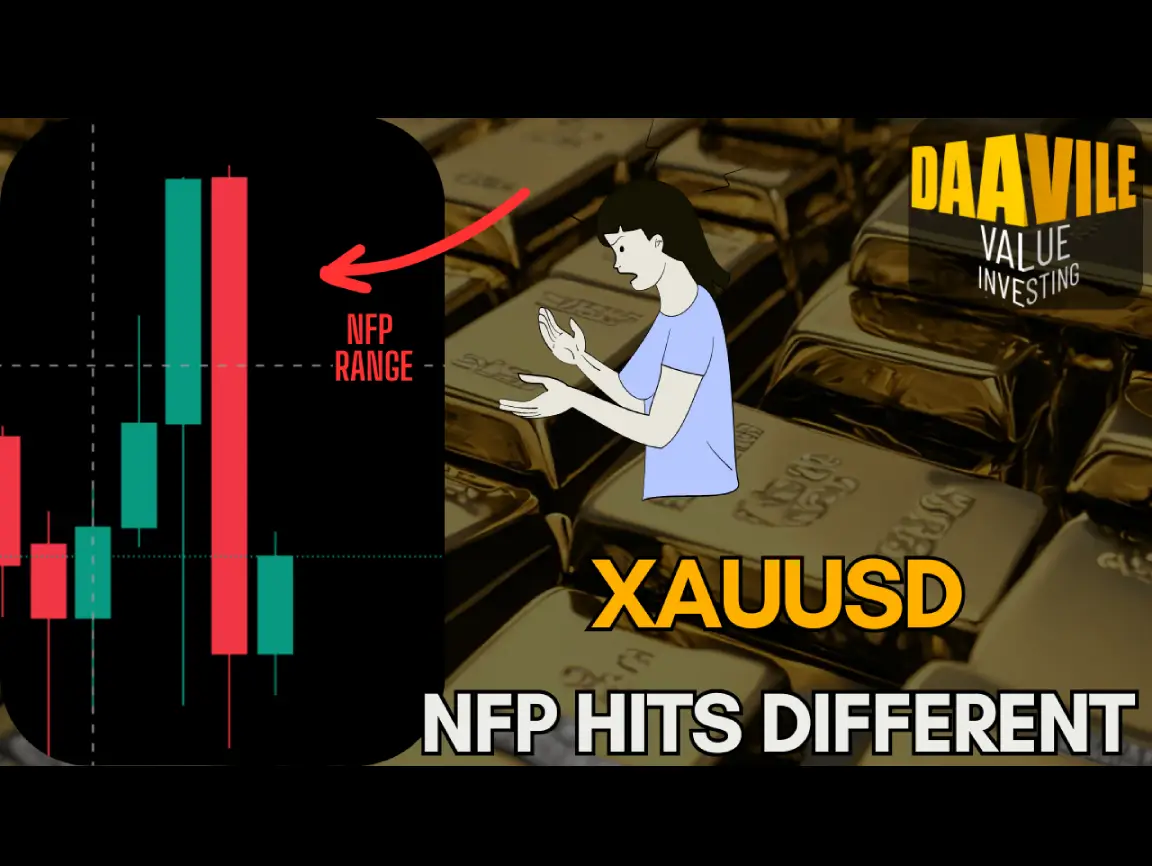
XAUUSD Post-NFP Price Action Breakdown: Important Zones To Mark!
XAUUSD Post-NFP Price Action Breakdown: Important Zones To Mark! The Non-Farm Payroll (NFP) report shook the markets, but XAUUSD price action post-NFP provided a golden opportunity for traders with the right tools. While many struggled to adjust, DAAVILE EA anticipated the moves and adapted its strategies in real time. With smart progressions and risk management techniques that go beyond basics like stop losses, DAAVILE EA consistently captured profits while minimizing exposure. This post-NFP breakdown highlights how DAAVILE EA outperformed once again, proving why it’s the ultimate choice for serious traders. https://youtu.be/x91-Z747x6U
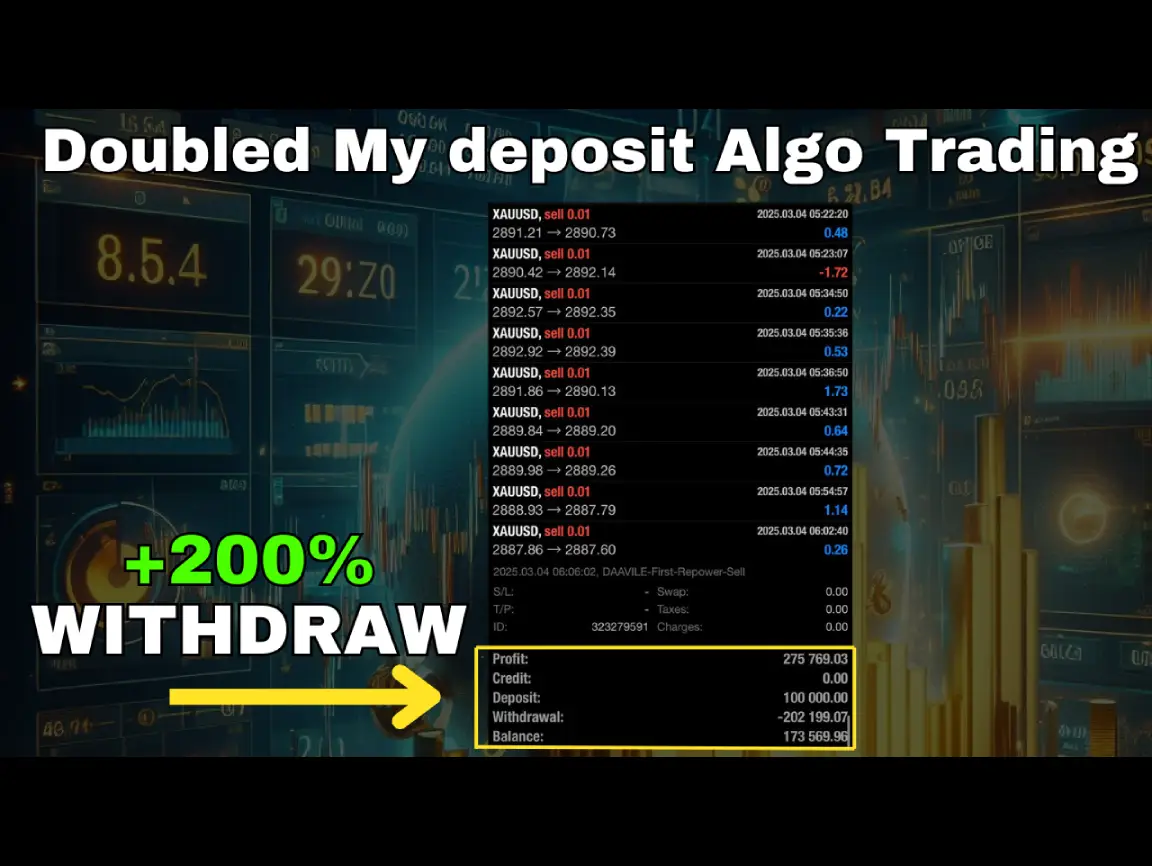
How I Achieved 275% XAUUSD Profits (Double My Deposit) with DAAVILE EA Live Trading!
275% ROI Trading XAUUSD: How I Doubled My Deposit With DAAVILE EA Live Results! I started with $100,000 and made a profit of $275,769. That’s not all—I withdrew $202,199, which is more than double my initial deposit, and still kept $175,569 in my account. These results don’t just speak for DAAVILE EA—they prove its power. In a market overrun by fake systems and so-called gurus, DAAVILE EA stands apart with consistent, real results that traders can actually trust. This isn’t just another trading bot. It’s a system I built from the ground up, leveraging advanced algorithms to adapt in real time to market conditions. Before the Non-Farm Payroll (NFP) event, I was already withdrawing profits, showing how this system stays ahead of market risks while locking in gains. This isn’t for amateurs relying on lazy strategies like stop losses. DAAVILE EA deploys smart progressions and advanced techniques to consistently maximize gains while keeping risk at a minimum. Profits like these aren’t about chance—they’re about precision. I’ve spent countless hours perfecting a system that dominates the XAUUSD market, trade after trade. DAAVILE EA doesn’t follow the crowd; it sets its own standard. This isn’t hype—it’s real. Every result is evidence of a system that outperforms, making even the most complex markets feel straightforward. This is trading at a level most systems can’t touch, and every trade brings me closer to financial freedom. https://youtu.be/h5oaq7x-48Y

LIVE ALGO TRADING #xauusd – SMOKING NFP WITH LOW RISK & ADVANCED STRATEGIES!
XAUUSD ADVANCED ALGO TRADING – SMOKING NFP WITH LOW RISK & REAL RESULTS! Gold trading demands precision, especially during high-volatility events like NFP. This isn’t about teaching; it’s about showcasing how real strategies translate into real results. Here’s an unfiltered breakdown of the current XAU/USD price action, backed by advanced algo trading and low-risk approaches. What makes NFP such a pivotal event in gold trading? A detailed look into NFP’s impact on gold markets. Key figures that illustrate its influence on price volatility. The Challenges of Navigating NFP Common mistakes traders make in high-volatility scenarios. How advanced systems mitigate these challenges. Algo-Driven Price Action How cutting-edge strategies dissect market movements. The edge automation provides when volatility spikes. Real Trades. Real Results. A showcase of precise entries, exits, and profits. Why these results matter for traders seeking consistency. https://youtu.be/APaWONBzZ0M

XAUUSD Analysis: Technical and Fundamental Insights from Daavile FX
XAUUSD Analysis: Technical and Fundamental Insights from Daavile FX Welcome to my channel! In this video, I’ll provide a comprehensive analysis of XAUUSD, covering both technical and fundamental aspects. Stay with me as I share expert strategies and market trends to help you make informed trading decisions. Don’t forget to subscribe and hit the notification bell for the latest updates! https://youtu.be/kawXxwBlBHU

XAUUSD ADVANCED ALGO TRADING – HIGH RISK:REWARD MODE DAAVILE FX V3 SYSTEM
XAUUSD ADVANCED ALGO TRADING – HIGH RISK:REWARD MODE DAAVILE FX V3 SYSTEM Welcome to my channel! In this video, I’ll explain the advanced algorithmic trading strategies of the Daavile FX V3 System for XAUUSD. You’ll learn about the high risk:reward mode and how it achieves impressive results. Stay with me as I cover the potential, challenges, and unique features of this powerful trading approach. Don’t forget to subscribe and hit the notification bell to stay updated with the latest insights and results! https://youtu.be/GWo2V1TOHGI

Maximizing Profits with Algo Trading: FTMO Prop Firm Plans for Daavile FX System (XAUUSD)
ALGO TRADING FTMO – PROP FIRM PLANS FOR DAAVILE FX SYSTEM – XAUUSD In this video, I’m explaining very freestyle what will be the plans for trading with my algo V3. It is important to note that trading mode is not yet 100% automatic like the investing model. Potential is huge, and I can make it work with prop firms very smoothly. However, since for backtesting purposes with the investing model, I’m not using any type of risk management, I’m the risk management. So, we could say it is skill-based how I get those 200% ROI in less than 1 month. Just for the ignorant who think EA means AI and the developer was gifted the code from God. Stay tuned! Subscribe to the channel and newsletter so you can stay updated with next week’s results and current month testings! https://youtu.be/AipA2WCt4Dg

XAUUSD ANALYSIS – GOLD MELTED LIKE ICE CREAM LAST WEEK
XAUUSD ANALYSIS – GOLD MELTED LIKE ICE CREAM LAST WEEK https://youtu.be/jFGJqMy79EM Hey traders, it’s Daavile FX here, breaking down the XAUUSD (Gold/USD) action from last week—March 2, 2025, showed gold melting like ice cream under the sun, dropping hard. Based on the latest market vibes and data, gold took a serious hit, sliding nearly 4.10% this week, hitting its lowest in over a week as of February 06, 2025, per reports. Here’s the quick scoop, keeping it chill but sharp for your trading edge. Gold’s big drop came from a mix of profit-taking after hitting record highs around $2,953 per ounce and growing unease over U.S. President Trump’s tariff plans, which spooked markets. By Friday, February 28, gold settled below $2,840, with bearish pressure piling on from reduced safe-haven demand and a stronger U.S. dollar. Traders saw support levels around $2,834–$2,835, where bulls might jump back in, but resistance at $2,864 need to break with good volume. The week kicked off with gold hitting all-time highs, but midweek, U.S. economic data—like PCE inflation and Fed rate cut chatter—shifted the mood. By Thursday, gold pulled back 2% from its peak, and Friday’s risk-off vibes sealed the deal, with a ceasefire rumor in Lebanon-Israel adding pressure. Posts on X also hinted at bearish sentiment, with traders noting gold rejecting key resistance zones and eyeing corrections to supports around $2,884–$2,875. For the U.S. economy, this drop’s a mixed bag—positive if it signals dollar strength and controlled inflation (Fed’s hawkish stance), but negative if it reflects trader panic or tariff fears slowing growth. Gold’s 0.11% dip by February 21 shows this trend carried over, with last week’s melt underscoring caution. Watch supports at $2,807 and retest at $2,834 for buys, but don’t expect a quick bounce with resistance looming. Trade smart, manage risk, and stay on top of Trump’s moves and U.S. data—this market’s tricky but full of chances if you play it right! —————————————————————-⭐️Visit www.daavile.com 🚨Verified resultshttps://daavile.com/results/ 🌟Get my system today!https://daavile.com/#pricing—————————————————————-⭐️FREE & PREMIUM MM INVESTMENT, SYSTEMS & COURSES💵 📊FREE & PREMIUM pre-tested systems to make money! ✅FREE courses from basic to advanced 📈FREE Money Management with profit split up to 80% for client! ✅Open account with my broker & cent accounts – TELETRADE 🌟https://my.teletrade.org/agent_pp.html?agent_pp=28108017 🤝DAAVILE Affiliate ID: 28108017 🌟 Ready to trade with RoboForex? Visit: https://my.roboforex.com/en/?a=mufn. 🤝 DAAVILE Forex EA and Affiliate Link: mufn. 📊FOREX VPS FOR ALGO TRADING 🔥IDEAL TO RUN TERMINALS 24/7 WITH NO NEED OF HAVING A PC TURNED ONALL THE TIME. ✅USE MY LINK https://portal.forexcheapvps.com/aff.php?aff=3134 🔥REAL RESULTS OF HUMAN & BOT MAKING MONEY 100% AUTO – RECAP DAAVILE 2021-2025https://youtu.be/3-34EbhTj_g———-⭐️DAAVILE EA: The 2021-2024 Journey to Automated Trading Success!https://youtu.be/AmXZUoEqCFY—————————————————————-✅Contact daavile.general@gmail.com ⭐️Instagram@daavilefx—————————————————————-DISCLAIMER:—————————————————————-The content presented in this video by DAAVILE is solely for educational purposes and should not be construed as financial advice. Trading inherently involves risks, and past performance is not a guarantee of future outcomes. Any strategies discussed are based on historical data and may not be suitable for all individuals. Always conduct your own thorough research and consult with a qualified financial professional, taking into account your unique circumstances, before making any investment decisions. DAAVILE and its affiliates assume no responsibility for any incurred losses. Viewer discretion is highly recommended.—————————————————————-#xauusd #forex #forexmarketanalysis #trader #forextradereview #trading #algotradingforex
