
DAAVILE FX Set & Forget Trading System 🚀 Set & Forget Trading That Works for You 24/7🔹 +200% ROI in under a month – no hype, just real results.🔹 No mentors, no fake gurus, no courses – even the Discord is free 😉.🔹 Build an edge before selling – that’s the real path to success. ❌ Why Most Trading Mentors Are a Scam🔴 No real, consistent results? They can’t trade.🔴 No backtesting proof? They don’t trade.🔴 Selling courses instead of trading? 🚩🚩🚩 💡 Stop following the noise. Start building. 📊 The Proof: Since 2019✅ Built & optimized since 2019 – Profitable since 2021✅ Multiple account results – Check the Discord CV section✅ Verified 113-week tracking record → +147% ROI✅ Every monthly broker statement available✅ Backtesting & forward testing results 📅 Feb 9 – Feb 28: ✅ Risk-Free: Withdrew my initial deposit → Risk = 0%✅ Paid Myself: 25% of profits → Beat last year’s S&P 500 💰 Tired of the Same Scams?🚫 Fake mentors, no real proof🚫 Discord & course sellers🚫 Strategies based on hope, not data 👉 Real results > hype. If they can’t prove it, they don’t trade. 🔗 Visit www.daavile.com – Ask for the March Special Promo!

XAU/USD: U.S. Economic Data & Gold – Melting Under Pressure: A Fragile Balancing Act
“The key to making money in stocks is not to get scared out of them.” – Peter Lynch The gold market has recently experienced a significant downturn. We’ve witnessed a near 4% drop from its all-time high, prompting many to ask: what’s behind this? The answer lies in a confluence of factors, notably the persistence of inflation and key technical developments. Recent data from the Federal Reserve’s preferred inflation gauge, the Core PCE, came in higher than anticipated, signaling that interest rates are likely to remain steady. This development has strengthened the U.S. dollar and, consequently, exerted downward pressure on gold prices. Adding to this, a classic double-top reversal pattern has emerged, further contributing to the sharp selloff. These are the moments that keep traders vigilant, as the market’s direction hangs in the balance. Gold’s Sharp Retreat: Analyzing the PCE Data’s Impact The selloff gained significant momentum once gold breached the critical $2,880–$2,900 liquidity zone. This zone represented a substantial support area, and its breach effectively removed a key safety net for gold. As a result, we observed a rapid decline, with the price action moving towards the next support level at $2,836, marked by a prominent bullish wick from mid-May. The prevailing question now is whether this decline represents a temporary correction or the beginning of a more extended bearish trend. Technical Breakdown: Examining Critical Support Levels To gain a deeper understanding of the situation, let’s analyze the technical indicators. The emergence of a double-top pattern at $2,957 signals a state of indecision in the market. Bears are now focused on the $2,836–$2,807 range. The breach of the $2,880 level acted as a catalyst, triggering stop-loss orders and intensifying the downward momentum. Interestingly, this occurred following negative unemployment claims, which would typically prompt a market re-fueling for a new all-time high. However, as we know, markets during Trump’s tenure are often characterized by heightened volatility and unpredictability. The $2,836 level represents the second imbalance zone, following yesterday’s test and re-test of $2,864, the first imbalance area. This inherent inefficiency provided the necessary volume for a precise test of imbalance 2. A close below $2,836 could open the door to $2,807, a level where major market players might step in to influence price action. What’s Next for Bulls? For gold to bounce back, buyers need to reclaim $2,864. Then, they need to break above $2,880. And not just a little break—a big, convincing one with volume. Think of it as a comeback scene in a movie. Without that? Bears are in control. And $2,807? That’s looking more and more likely. Gold’s Fate: Inflation Fears vs. Technical Repair The question remains inflation’s impact on gold versus a technical rebound As of February 28 2025 the Federal Reserve maintains steady rates with inflation persistently high Core PCE stands at 2.6% year-over-year exceeding the 2% target This strengthens the dollar and pressures gold down nearly 4% from its $2970 peak Geopolitical events and election-year volatility may offer gold support but current charts indicate a sell signal double-top confirmed support at $2880 breached next target $2836 Buyers require significant intervention. U.S. Economic Data & Gold (XAU/USD): A Fragile Balancing Act Data indicates GDP remains at 2.3% unemployment claims increased to 242K from 220K and Core PCE remains at 0.3% month-over-month annualized to 2.6% Inflation persists Gold reached record highs in 2025 but now declines to $2836 and continues This decline is attributed to profit-taking and a strong dollar The Federal Reserve addresses inflation with high rates no rate cuts are anticipated therefore the USD strengthens while gold weakens. Political Risks & Market Sentiment Policy uncertainties and recession concerns create market volatility Skepticism surrounds market volatility and policy uncertainties reminiscent of 2011 but with increased fragility Rising unemployment claims indicate potential economic challenges Core PCE decreased to 2.6% from 2.8% year-over-year but the 0.3% monthly increase suggests persistent inflation above the Federal Reserve’s 2% target A weaker dollar could support gold but the dollar’s strength currently suppresses gold. Forecast & Strategic Takeaways The potential for $2000/oz exists contingent on geopolitical events or Federal Reserve policy changes The dollar’s strength is driven by inflation and interest rates A Core PCE decrease below 2.5% could alter market dynamics Policy uncertainties remain a factor Gold serves as a hedge against these uncertainties. Conclusion: Gold at a Crossroads—Inflation, Dollars, and Uncertainty Gold’s decline nearly 4% from $2970 as of February 28 2025 is not a minor correction Core PCE at 2.6% year-over-year with a 0.3% monthly increase results in Federal Reserve commitment to high rates strengthening the dollar and weakening gold Charts confirm this double-top at $2970 and breached $2880–$2900 support triggered a selloff to $2836 with $2807 as the next target if buyers do not intervene Profit-taking is a factor but policy uncertainties recession concerns and increased unemployment claims to 242K indicate deeper vulnerabilities Geopolitical events or a Federal Reserve policy change could return gold to $2000/oz or initiate a rebound Buyers must reclaim $2864 and breach $2880 to regain control Currently inflation prevails the dollar is strong and gold’s future depends on the balance between economic uncertainty and technical factors Market participants must remain vigilant as market conditions can change rapidly.
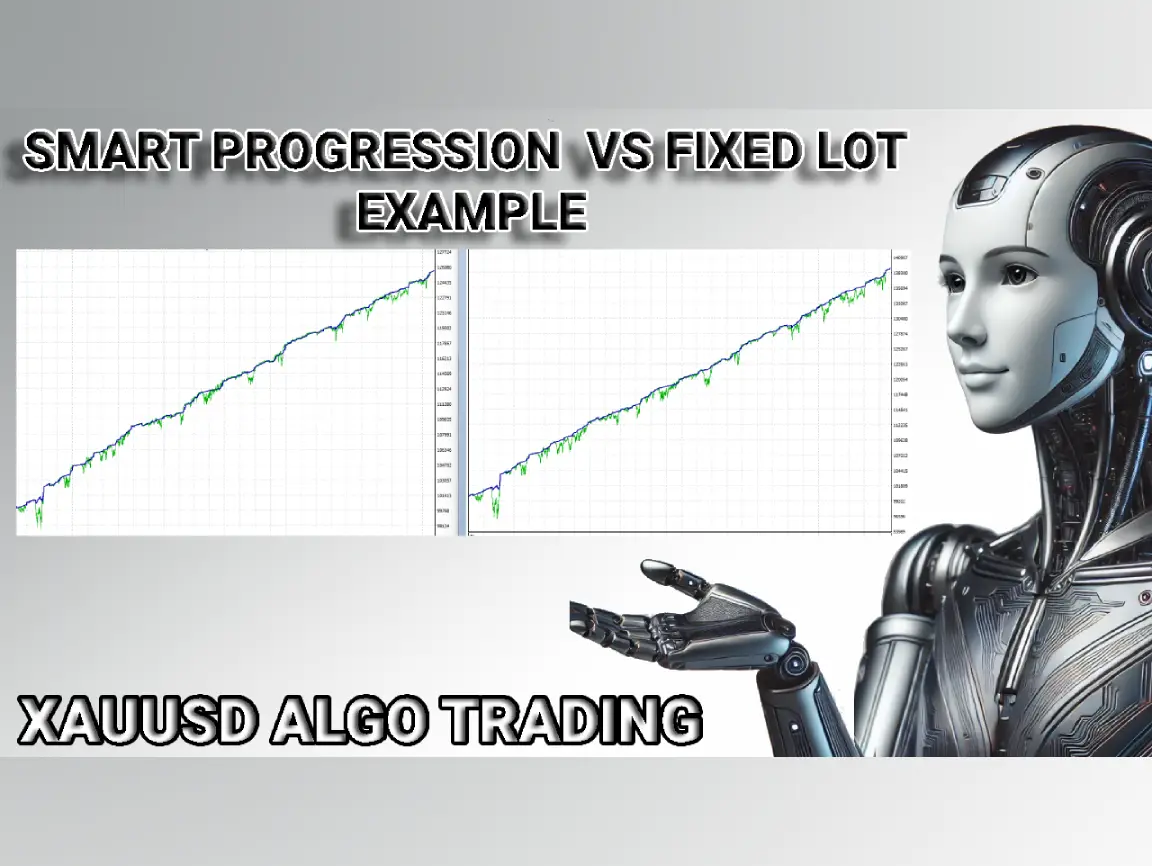
XAUUSD Algo Trading: Fixed Lot vs. Smart Progression | Backtesting Insights VIDEO
https://youtu.be/X3fvLNX6fRI XAUUSD ALGO TRADING- FIXED LOT VS SMART PROGRESSION BACKTESTING EXAMPLE TODAY I WILL SHOW THE DIFFERENCE BETWEEN FIXED LOT AND SMART PROGRESSION WHEN TRADING GRID SYSTEMS.————————————–I WILL BE USING MY EA WITH A TRADING MODE IM TESTING THAT IS VERY AGRESSIVE WITH HIGH VOLUME OF TRADING CALLED: SPEED TRADING —————–I WILL USE SAME SETFILE/STRATEGY WITH SAME EA.———————————-I WILL USE VERY BASIC EXAMPLE TO TEST.————————————FIXED LOT MEANS EVERY LOGIC MY EA IS USING WILL HAVE SAME INITIAL AND LAST LOT E.X FIXED LOT LOGIC1= INITIAL LOT: .01LAST LOT: .01 LOGIC 2= INITIAL LOT: .02LAST LOT: .02 ————-SMART PROGRESSIONLOGIC1= INITIAL LOT: .01LAST LOT: .05MULTIPLIER: 1.5 LOGIC 2= INITIAL LOT: .01LAST LOT: .02MULTIPLIER: 1.25 ———–I DO THIS FOR MULTIPLE PURPOSES BUT MAINLY FOR1. IDENTIFY MY 21 LOGICS; WHEN IM USING MY SYSTEM FULL LOGICS, I HAVE ISSUES TO DETECT WHAT EACH ONE IS DOING, SO I USE FIXED LOT TO ID EACH LOGIC.2. I DONT ADD MULTIPLIER ALL IN CAUSE THEY CAN OVERFIIT RESULTS OR SHOW VERY GOOD RESULTS COVERING RISK.SOME TIMES BIG LOTS GENERATE BIG PROFITS THAT DOUBLE ACCOUNTS FAST BUT THAT MEANS PROFITS ARE SAVING ACCOUNT AND EA IS OVERFITTED AND NOT WELL TRAINED.———————-THATS WHY ALWAYS USE PROFIT AND MAX DRAWDOWN AS DATA NOTHING ELSE MATTER WHEN BUILDING.———————-LETS SEE THE DIFFERENCE.
XAU/USD Live Trading Analysis: Technical and Fundamental Breakdown by DaavileFx -VIDEO
XAU/USD Live Trading Analysis: Technical and Fundamental Breakdown DaavileFX shares the latest XAU/USD live trading analysis, featuring a complete technical and fundamental breakdown. Stay updated with gold price movements, key economic data, and market trends. As always, trading is about reacting, not predicting. Let’s dive into the charts and data. https://youtu.be/QW5on-G7V58
XAU/USD Live Trading Analysis: Technical and Fundamental Breakdown by DaavileFx
Welcome to today’s live XAU/USD trading analysis. Right now, gold is testing the $2,890 level, an area I highlighted in yesterday’s post[https://daavile.com/xauusd-analysis-26th-feb/ ]. It’s holding with remarkable precision, which is something to pay attention to. Today’s economic data from the U.S. has revealed some concerning trends. The latest GDP and unemployment claims suggest that the rapid recovery projected for 2025 may be slowing down. This shift can be attributed to the current political climate, particularly the influence of figures like Donald Trump and Elon Musk. Let’s be blunt: the U.S. economy is facing significant challenges. The administration’s focus on personal vendettas over national priorities is creating a volatile environment. The potential for an ‘artificial lockdown’ with high inflation and rising debt is a serious threat. For us traders, this means that any downward movement in gold should be viewed as a retracement before further upward momentum. The current political and economic uncertainty is likely to continue supporting gold prices in the long term. To give you a clearer picture, here are some key news headlines from today, February 27th, 2025: Gold Prices Drop to $2,892: Will the Bearish Trend Continue? Gold Forecast: $2,890 – a Tough Nut to Crack for XAU/USD Sellers? Gold Faces Consolidation as US Dollar Rebounds Before Crucial Data XAUUSD Forecast Suggests Growth to $2,940 Amid Weak US Economic Data These headlines, along with the data we’ve seen, paint a picture of a market reacting to both economic indicators and political uncertainty. In this analysis, we’ll break down the technical and fundamental factors affecting XAU/USD, giving you a clear understanding of the current market panorama and price action. As always, trading is about reacting, not predicting. Let’s dive into the charts and data. Fresh Price Action: Understanding the Breakout and Liquidity “To break important zones, we need huge liquidity,” as I shared in yesterday’s post. And indeed, liquidity was clearly accumulating in this area over the past weeks, making this reaction natural. What feels unexpected is the move to the downside. I’ll be researching to see if there’s a logical explanation or if the market is playing a larger retracement. Context: Breaking the $2,890 Area with Volume Gold is currently breaking the major zone we were reviewing yesterday and in this post. Breaking the $2,890 area with huge volume. The nature, volume, and direction of the movement were unusual. It was after today’s news, which was negative for the USD, that something which, based on basic principles, would be positive for gold, occurred. That’s why we always react—the accumulated liquidity in the area was used to mitigate support and quickly and efficiently burn stop losses (SL) by institutions. In this way, they are able to buy back at lower prices and take advantage of the natural trend, which, given the macroeconomic conditions, is currently bullish. It’s possible that institutional players took advantage of Nvidia and its release today. Classic Fakeout – SL Hunt The area marked in blue had significant liquidity on both sides, with supports and resistances respected since February 5th, when the first rejection occurred. It’s very common for us to think that this is a zone being respected, and with the news, fundamentals, and technicals aligning to give a bullish bias, that’s when they blow up your analysis and take out your SL. We need to remember, gold hasn’t broken the macroeconomic structure started in January-February of 2024. Pressure for bulls grows over time since they can’t hold pressure over the dollar for so long, even if data is showing slow recovery from the USA. Remember, only the USA going to literal 0 will kill XAU/USD. Fundamental Factors Driving XAU/USD: A Condensed Overview The U.S. Dollar Index (DXY) is experiencing a significant rebound, driven by a combination of factors. Recent U.S. GDP readings have revealed persistent inflationary pressures, catching markets off guard. This has strengthened the dollar, impacting gold prices negatively. The U.S. Dollar Index (DXY) has rebounded from its 11-week lows, driven by uncertainty over U.S. President Donald Trump’s tariff plans, which has increased demand for the dollar at the expense of gold (Investing.com, 2025). Rising U.S. Treasury yields have also reduced gold’s appeal as a non-yielding asset, contributing to its decline (Reuters, 2025). Key points to consider: GDP and Inflation: Higher-than-expected GDP and inflation figures are pushing the dollar higher. This affects gold, as higher interest rates (used to combat inflation) make gold less attractive. Trump’s Tariffs: Uncertainty surrounding President Trump’s tariff plans is adding to market volatility and influencing the dollar’s strength. His recent announcements about tariffs on Canada, Mexico, and China, effective March 4th, are creating significant market ripples. Federal Reserve Activity: Multiple Federal Reserve officials are scheduled to speak, and their comments will be closely watched for clues about future interest rate decisions. The market is also closely watching the PCE data, as it is the FEDs preferred inflation gauge. Technical Outlook: The DXY is breaking above key levels, indicating potential further gains for the dollar. This is putting downward pressure on gold. Overall Market Sentiment: While geopolitical tensions usually support gold, the current positive sentiment in equity markets is weighing on gold prices. Essentially, the stronger dollar, driven by inflation and tariff uncertainties, is the primary fundamental factor impacting XAU/USD right now. Traders should closely monitor GDP, inflation data, and Trump’s tariff announcements.” Key points to consider: GDP and Inflation: Higher-than-expected GDP and inflation figures are pushing the dollar higher. This affects gold, as higher interest rates (used to combat inflation) make gold less attractive. Trump’s Tariffs: Uncertainty surrounding President Trump’s tariff plans is adding to market volatility and influencing the dollar’s strength. His recent announcements about tariffs on Canada, Mexico, and China, effective March 4th, are creating significant market ripples. Federal Reserve Activity: Multiple Federal Reserve officials are scheduled to speak, and their comments will be closely watched for clues about future interest rate decisions. The market is also closely watching the PCE data, as it is the FEDs preferred inflation gauge. Technical Outlook: The
XAUUSD Analysis: Expert Insights on Gold Price Movements
XAUUSD ANALYSIS: Identifying Key Opportunities with DaavileFX XAUUSD is a crucial instrument for traders seeking both stability and profit in today’s financial markets. As someone who analyzes XAUUSD daily, I’m here to provide a straightforward breakdown of recent price action. Forget the complex jam gurus use; we’ll focus on charts and factual observations. This analysis will cover the key factors influencing XAUUSD, giving you a clear picture of what’s driving the market. At DaavileFX, my goal is to provide practical insights that you can use in your trading. Price Movement: A Shift in Dynamics Gold has been on a consistent upward trend, influenced by market uncertainties, economic data, and investor sentiment. Concerns over inflation, interest rates, and geopolitical tensions have supported this movement. However, recent price action indicates a significant shift. This week, we observed a substantial bearish candle breaking through the established bullish channel. A subsequent failed retracement suggests potential liquidity formation around the critical $2,894 to $2,880 range, an area of historical significance as both support and resistance. Compounding this, we’ve seen a clear double bottom formation in this zone, not a negation of it. This zone is exceptionally important. I strongly advise readers to mark this area on their charts, as price will likely revisit it. The reaction upon revisiting could be substantial due to the trapped liquidity. Quick Exercise: Take a close look at the provided chart. Note the wicks, rejections, and changes in trend within this zone. You’ll observe why I’m maintaining such close observation. This area has proven to be highly effective for both scalping and position trading. Trading is about reacting to the market, not predicting it. As you’ll see in the next chart, this zone provided excellent opportunities for both short-term and longer-term trades. “The stock market is filled with individuals who know the price of everything, but the value of nothing.” — Philip Fisher Key Data Points and Market Sentiment Recent price ranges have seen gold trading around $2,942 USD per ounce on February 25th and $2,890 USD on February 26th. Earlier in February, gold reached record highs around $2,955.54 USD. The market currently exhibits a blend of consolidation and volatility, with investors seeking gold as a hedge against economic uncertainty. Economic Factors and Geopolitical Influences Federal Reserve interest rate decisions and economic data releases remain pivotal. Despite no immediate major price movements expected from macroeconomic data, gold’s role as an inflation and economic uncertainty hedge is unwavering. Geopolitical tensions, including U.S. trade policies and global economic shifts, further enhance gold’s safe-haven status. Technical Analysis: Chart Insights and Strategic Implementation As depicted in Chart 1, meticulous attention to detail is crucial. Even within a 4-hour timeframe, key areas can be identified and marked. This allows for strategic shifts in trading models. During periods of slow investment opportunities, more aggressive trading strategies can be deployed to capitalize on market fluctuations. This is where the DaavileFX “set & forget” trading system excels. Designed to adapt to varying market conditions, it enables traders to profit regardless of market dynamics. Whether employing investing models for long-term growth or trading models for short-term gains, the system is engineered to deliver consistent results. XAUUSD Analysis: A Chronicle of Gold’s Ascent With no recent positive news for the U.S. and ongoing fundamental pressures on the dollar, influenced by figures like Trump and Elon Musk, a bullish gold closing cycle is anticipated as February concludes. A Bearish Grip (September-October 2024): By the end of October 2024, XAUUSD was under significant downward pressure due to a strengthened US economic picture. Positive economic data and a hawkish Federal Reserve policy created a bearish structure for gold. Positive US jobs reports, rising inflation figures, and Fed statements signaling continued rate hikes all contributed to dollar strength and gold’s decline. This bearish phase set the stage for a critical market shift. The Turn of the Tide (November-December 2024): November and December saw a clear change in XAUUSD’s direction. Geopolitical tensions increased, boosting demand for safe-haven assets like gold. The anticipation of stable or even increasing interest rates by major central banks further supported gold prices by maintaining the pressure on the US dollar. Despite a brief dip following strong US employment data, gold quickly recovered as the market awaited inflation data. Technically, gold broke out of a sideways trading range, showing upward momentum and targeting higher resistance levels. This period marked a decisive shift in market sentiment toward gold. Breaking Free (Early 2025): 2025 began with XAUUSD extending its gains. Rising US jobless claims and forecasts of slowing GDP growth weakened the dollar, making gold more attractive. Rising inflation expectations provided additional support. Technical analysis confirmed the bullish trend, with patterns indicating further upward movement. The market anticipated a test of all-time highs. Conquering the Peak (January 2025): In January 2025, XAUUSD achieved new all-time highs. The confluence of factors—economic uncertainty, dollar weakness, and positive technical signals—propelled gold into uncharted territory. The psychological barrier of previous highs was broken, paving the way for further price appreciation. Holding Strong (Ongoing 2025): Since the breakout, XAUUSD has continued its strong performance. Pullbacks have been minimal, and the overall trend is firmly bullish. The story of a weakening dollar and gold’s safe-haven appeal persists, driving demand and supporting higher prices. The market is now focused on identifying new resistance levels and assessing the long-term implications of the current economic environment. The Future Outlook: Going forward, several key factors will determine XAUUSD’s trajectory. Developments in global economic growth, inflation, and interest rate policies are critical. Geopolitical events and shifts in market sentiment will also play a role. Technical analysis will continue to provide insights into potential support and resistance. While the recent surge has been substantial, careful investors will monitor these factors and adapt their strategies accordingly. NEXT FUNDAMENTAL EVENTS Thursday, Feb 27 Prelim GDP q/q: Actual: 2.3% Forecast: 2.3% Impact on XAU/USD: Moderate Details: A GDP growth rate that meets expectations typically has a neutral impact on gold. However, if the actual figure deviates significantly

High-Gain Forex Algo Trading: Speed & Rebates
Speed & Rebates Rebates past experiences BACKTESTING INVESTING VS SPEED TRADING Breakdown Conclusion Speed & Rebates: Secret weapon with huge risk My work in the financial markets, particularly with XAUUSD, involves developing and testing algorithmic trading strategies for MT4 and MT5. Currently, I’m focused on creating a tailored solution for a client, designed to achieve high gains through a specific approach that leverages market volatility both sides. This is a bespoke trading strategy, not a standard rebate program. I’m crafting a customized system based on the client’s requirements, using my expertise to optimize the trading process. Through detailed testing and ongoing refinement, the goal is to maximize trading volume while managing an adjusted risk based on the client’s requirements. Now, let’s talk about rebates. Imagine you’re trading, and with every trade you make, you’re getting a small percentage of your trading volume back. It’s like getting paid to trade. That’s essentially what rebates are. Brokers often offer these to incentivize trading activity. The more you trade, the higher your volume, and the more rebates you earn. Think of it like this: you place a trade, and a portion of the spread or commission is returned to you. Over time, these small amounts add up significantly, especially with high-volume strategies. Furthermore, brokers often have tiered rebate programs. The higher your trading volume or account status (like VIP), the larger the percentage of rebates you receive. This means that with a well-optimized, high-volume strategy, you can significantly boost your overall profitability through rebates, effectively turning trading activity into an additional revenue stream. Rebates past experiences In the past, while exploring algo trading forums, I found a specific group of traders interested in rebates. While I knew they offered good potential, especially since I was trading high risk-volume at the time, the risk stopped me from thinking of rebates as an option. I was focused on fast account growth, not the controlled environment needed for consistent passive income. I saw that many rebate traders used scalpers and low-pip grid systems, often claiming to be high-frequency trading (HFT). However, these systems, based on simple logic, were weak against strong trends that could quickly empty an account, leading to big losses. I first thought these strategies were just people wanting easy money without real trading skills. However, I’ve learned that judging and being negative isn’t helpful, especially when people are just trying to find their own trading method. My own experience, with daily testing and trading, isn’t the same for everyone. The idea of rebates, especially the monthly payouts, stayed with me. As I learned more about risk and improved my trading systems, I saw the potential for big rebate growth. It was clear that a good, high-volume strategy, with good risk control, could make a strong, regular income from rebates. Investing portfolio 113 weeks +12,000 trades closed “In investing, what is comfortable is rarely profitable.” — Robert Arnott Investing & Trading I categorize my trading systems into two distinct styles: investing and trading, each with its own risk profile. Investing focuses on long-term growth, employing a slow, controlled risk-reward approach based on extensive historical data, such as market behavior from 2004 to 2025. Trading, on the other hand, is short-term, characterized by high risk-reward ratios, aimed at quick profits with minimal market exposure. Naturally, my investing model lends itself well to generating high-volume rebates. By adjusting the logic to scalp more aggressively within smaller price ranges, I can significantly increase trading frequency. This is a robust strategy that I now integrate into my investing models. However, the majority of the volume is generated through very small lot sizes, typically 0.01 or 0.02, while larger lots are opened less frequently. Make no mistake, this approach has added a substantial 30% to my investment returns as essentially free money, and with compounding, its power is undeniable. But not everyone has the patience for a long-term strategy, or they prefer a system specifically tailored to maximize rebates. This allows them to leverage the premium, diamond, VIP, and other high-status benefits offered by brokers after large deposits. BACKTESTING INVESTING VS SPEED TRADING When evaluating trading strategies, backtesting provides crucial insights into potential performance. Here, we’ll compare the results of my speed trading and investing models using data from December 1, 2024, to February 22, 2025. Speed Trading Model: Initial Deposit: $100,000 USD Profit Factor: 6.59 Total Trades: 10,741 Maximum Drawdown (DD): $5,743 Win Rate: 86% (9,274 winning trades) Investing Model: Initial Deposit: $100,000 USD Profit Factor: 3.10 Total Trades: 703 Maximum Drawdown (DD): $780 Win Rate: 92% (649 winning trades) Breakdown: The speed trading model demonstrates a significantly higher trading volume and profit factor over the three-month period. This indicates a strategy finely tuned to capitalize on short-term market fluctuations, generating substantial rebates through its high trade frequency. However, it’s essential to note that this model, while promising, is only 25% complete. Further forward testing is required to validate its performance and ensure robustness, especially when dealing with low tick data. It is also important to note that the high win rate and profit factor are indicative of a model that is very well fitted to the past 3 months of data. Conversely, the investing model, while exhibiting a lower profit factor and trading volume, showcases a more conservative approach with a significantly lower drawdown. This model, currently operating with a simplified buy-only logic (the sell logic is optimized separately) and a fraction of its total logic components, is not designed for the short-term, high-frequency environment reflected in the backtesting period. The low risk-reward ratio is a direct result of the prevailing bullish market conditions, given its counter-trend nature. Conclusion: This comparison highlights the distinct characteristics of speed trading and investing strategies. Speed trading, with its high volume and profit potential, is ideally suited for maximizing rebates and leveraging broker benefits. However, it requires rigorous testing and optimization to mitigate the risks associated with its high-frequency nature. Investing models, while offering stability and lower risk,

Gold Prices Smoking Everyone Including Dollar: What You Need to Know Now
XAUUSD Analysis: A Rollercoaster Ride to New All-Time Highs In a dramatic turn of events, gold prices have skyrocketed, leaving the US Dollar trailing in the dust. Just when it seemed like the Federal Reserve had things under control—after reducing interest rates three times in the last months of 2024, bringing the rate down to a range of 4.25% to 4.50%—the market has been thrown into chaos. The volatility is largely fueled by unpredictable statements from Donald Trump and Elon Musk, which have created a storm of uncertainty and market reaction. Recent data shows that gold prices have surged to record highs, with spot gold trading around $2,935 per ounce. This bullish trend is driven by a combination of factors, including geopolitical tensions, inflation fears, and market uncertainty. Trump’s recent announcements of additional tariffs on various imports have added to the market’s anxiety, pushing investors towards safe-haven assets like gold. Recent data shows that gold prices have surged to record highs, with spot gold trading around $2,950 per ounce, breaking past year ATH $2,791. This bullish trend is driven by a combination of factors, including geopolitical tensions, inflation fears, and market uncertainty. Trump’s recent announcements of additional tariffs on various imports have added to the market’s anxiety, pushing investors towards safe-haven assets like gold. On the other hand, the US Dollar has faced significant pressure. The Dollar Index (DXY) has seen fluctuations, reflecting the ongoing economic concerns. Despite the Federal Reserve’s efforts to stabilize the economy, the dollar’s strength has been undermined by weak consumer confidence and economic data. The Fed’s decision to maintain interest rates has also contributed to the dollar’s struggles. Adding to the market’s turmoil, Elon Musk’s unpredictable comments and actions have further fueled volatility. His influence on the cryptocurrency market and his involvement in various economic discussions have created additional layers of uncertainty. For example, Musk’s recent directive for federal employees to justify their jobs via email has sparked widespread controversy and backlash. “ Elon Musk, who heads the newly-created Department of Government Efficiency (DOGE), recently sent an email to federal employees requesting that they justify their jobs by summarizing their work for the week. The email, which had the subject line “What did you do last week?”, asked employees to respond with approximately five bullet points of their accomplishments and to cc their manager. Musk warned on social media that failure to respond would be taken as a resignation. This directive has caused significant controversy and backlash among federal employees, unions, and government officials. Many view it as an intrusive and disrespectful measure, especially towards veterans and long-serving civil servants. Union leaders have criticized the email as “cruel” and “un-American,” and have vowed to challenge any unlawful terminations. ” XAUUSD Analysis: A Chronicle of Gold’s Ascent A Bearish Grip (September-October 2024): By the end of October 2024, XAUUSD was under significant downward pressure due to a strengthened US economic picture. Positive economic data and a hawkish Federal Reserve policy created a bearish structure for gold. Positive US jobs reports, rising inflation figures, and Fed statements signaling continued rate hikes all contributed to dollar strength and gold’s decline. This bearish phase set the stage for a critical market shift. The Turn of the Tide (November-December 2024): November and December saw a clear change in XAUUSD’s direction. Geopolitical tensions increased, boosting demand for safe-haven assets like gold. The anticipation of stable or even increasing interest rates by major central banks further supported gold prices by maintaining the pressure on the US dollar. Despite a brief dip following strong US employment data, gold quickly recovered as the market awaited inflation data. Technically, gold broke out of a sideways trading range, showing upward momentum and targeting higher resistance levels. This period marked a decisive shift in market sentiment toward gold. Breaking Free (Early 2025): 2025 began with XAUUSD extending its gains. Rising US jobless claims and forecasts of slowing GDP growth weakened the dollar, making gold more attractive. Rising inflation expectations provided additional support. Technical analysis confirmed the bullish trend, with patterns indicating further upward movement. The market anticipated a test of all-time highs. Conquering the Peak (January 2025): In January 2025, XAUUSD achieved new all-time highs. The confluence of factors—economic uncertainty, dollar weakness, and positive technical signals—propelled gold into uncharted territory. The psychological barrier of previous highs was broken, paving the way for further price appreciation. Holding Strong (Ongoing 2025): Since the breakout, XAUUSD has continued its strong performance. Pullbacks have been minimal, and the overall trend is firmly bullish. The story of a weakening dollar and gold’s safe-haven appeal persists, driving demand and supporting higher prices. The market is now focused on identifying new resistance levels and assessing the long-term implications of the current economic environment. The Future Outlook: Going forward, several key factors will determine XAUUSD’s trajectory. Developments in global economic growth, inflation, and interest rate policies are critical. Geopolitical events and shifts in market sentiment will also play a role. Technical analysis will continue to provide insights into potential support and resistance. While the recent surge has been substantial, careful investors will monitor these factors and adapt their strategies accordingly. NEXT FUNDAMENTAL EVENTS Thursday, Feb 27 Prelim GDP q/q: Actual: 2.3% Forecast: 2.3% Impact on XAU/USD: Moderate Details: A GDP growth rate that meets expectations typically has a neutral impact on gold. However, if the actual figure deviates significantly from the forecast, it could lead to increased volatility. A higher-than-expected GDP growth could strengthen the US Dollar, potentially pushing gold prices down. Unemployment Claims: Actual: 222K Forecast: 219K Impact on XAU/USD: Moderate Details: Higher-than-expected unemployment claims can indicate economic weakness, which might lead to a weaker US Dollar and higher gold prices. Conversely, lower claims could strengthen the dollar and put downward pressure on gold. Friday, Feb 28 Core PCE Price Index m/m: Actual: 0.3% Forecast: 0.2% Impact on XAU/USD: High Details: The Core PCE Price Index is a key inflation measure. A higher-than-expected reading suggests rising inflation, which can boost gold prices as

DAAVILE FX OFFICIAL BROKER LIST WITH AFFILIATE LINKS
“Risk is managed, not avoided—control it, and profits will follow.”

The Importance of VPS in Algo Trading for Daavile FX: Forex Algo Trading with ForexCheapVPS.com
Understanding Gold (XAU/USD) and the U.S. Economy: A Weekly Recap “Profits follow discipline—control your emotions, follow your strategy, and let the market do the rest.” Can gold predict the future of the U.S. economy? While it’s not a crystal ball, its price movements offer valuable clues about investor sentiment, inflation expectations, and the overall health of the market. This week, the headline is “gold down, economy strong,” but the full story is more nuanced. This recap of XAU/USD price action, combined with a look at crucial economic indicators, reveals a landscape of expanding business activity, low unemployment, and a Federal Reserve focused on keeping inflation in check. Want to understand where the U.S. economy is headed? One of the best places to look is the gold market. This week’s XAU/USD analysis, coupled with a breakdown of major economic releases, provides valuable insights for traders and investors. From FOMC minutes to presidential speeches, we’ll cover the events that moved the market and what they mean for your portfolio. Join me as we unpack the key events and their implications, giving you the insights you need to stay ahead of the curve. Gold (XAU/USD) has long been a barometer of economic sentiment, reflecting shifts in risk appetite, inflation expectations, and monetary policy. Analyzing gold prices alongside U.S. economic data allows us to uncover valuable insights into both macroeconomic trends and micro-level market behavior. The Big Picture: Gold, the U.S. Economy, and Future Cycles Last week’s data painted a picture of a resilient U.S. economy, with low unemployment, expanding business activity, and a hawkish-leaning Fed. Gold’s slight decline (-0.11%) reflects this optimism, as investors favored risk assets over safe havens. This week’s recap highlights how gold responded to key events, offering a lens into the broader economic landscape. Key Takeaways: Gold as an Economic Indicator: Gold’s performance often signals shifts in risk sentiment and inflation expectations. Last week’s stability and slight decline suggest confidence in the U.S. economy. Macro Insights: Strong labor data and PMI readings point to continued economic expansion, while the Fed’s hawkish tone underscores a focus on inflation control. Micro-Level Analysis: Presidential speeches, while influential, did not disrupt the broader economic narrative, highlighting the importance of data-driven trends over short-term rhetoric. By understanding these dynamics, traders and investors can better anticipate future economic cycles and position themselves accordingly. Gold remains a critical tool for navigating both macroeconomic trends and micro-level market behavior. Sunday, February 16 – No Red Folder Event What Happened: No significant U.S. economic data or events were released. Markets remained quiet, reflecting a typical low-volatility weekend. Gold & Economic Implications: Gold prices held steady, signaling a neutral market sentiment. With no catalysts to drive risk-on or risk-off behavior, the U.S. economy remained in a holding pattern, neither gaining nor losing momentum. Monday, February 17 – No Red Folder Event What Happened: Another uneventful day with no major economic reports or speeches. Markets continued to trade in a narrow range. Gold & Economic Implications: Gold prices showed minimal movement, maintaining the stability seen on Sunday. The lack of volatility reinforced a neutral outlook for the U.S. economy, with no immediate pressures or catalysts to alter the status quo. Tuesday, February 18 – President Trump Speaks (3:13 PM & 8:00 PM) What Happened: President Trump delivered two speeches, touching on trade, jobs, and the U.S. dollar. His remarks often influence market sentiment, as hints of economic uncertainty or dollar weakness can drive investors toward gold as a safe haven. Gold & Economic Implications: Gold ended the week down 0.11% by February 21, suggesting that Trump’s speeches did not trigger significant safe-haven demand. This indicates a lack of immediate economic concerns, with markets interpreting his comments as neutral to slightly positive for the U.S. economy. Wednesday, February 19 – FOMC Meeting Minutes (1:00 PM) & President Trump Speaks (4:00 PM) What Happened: The Federal Reserve released its FOMC meeting minutes, providing insights into interest rate policy and inflation outlook. Higher rates typically weigh on gold, as they boost the dollar and bond yields, while dovish signals support gold prices. Trump’s speech later in the day added another layer of market sentiment. Gold & Economic Implications: Gold prices dipped slightly, suggesting the Fed’s tone may have leaned hawkish, hinting at potential rate hikes. This is a positive sign for the U.S. economy, as it reflects confidence in controlling inflation. However, it creates headwinds for gold. Trump’s speech did not significantly alter the narrative, leaving gold modestly lower. Thursday, February 20 – Unemployment Claims (7:30 AM) & President Trump Speaks (6:20 PM) What Happened: Unemployment claims came in at 214K, below the threshold that signals labor market strength. Low claims typically indicate a robust job market, reducing the appeal of gold as a safe haven. Trump’s evening speech added further context to the day’s economic narrative. Gold & Economic Implications: The low unemployment figure is a clear positive for the U.S. economy, reflecting strong job creation. Gold prices edged lower, likely due to a stronger dollar and reduced safe-haven demand. Trump’s remarks did not disrupt the overall positive sentiment, reinforcing the economy’s stability. Friday, February 21 – Flash Manufacturing PMI (8:45 AM), Flash Services PMI (8:45 AM) & President Trump Speaks (2:56 PM) What Happened: The Flash Manufacturing PMI registered 51.2, while the Flash Services PMI came in at 52.9. Both figures above 50 indicate expansion, signaling healthy business activity. Trump’s afternoon speech provided additional market context. Gold & Economic Implications: Strong PMI readings are another positive indicator for the U.S. economy, suggesting robust growth in both manufacturing and services sectors. Gold prices closed the week down 0.11%, likely pressured by a stronger dollar and profit-taking. Trump’s speech did not significantly impact the market, leaving gold’s downtrend intact. NEXT WEEK US RED FOLDER Global Markets “The Week That Was, The Week Ahead: Macro & Markets, February 23, 2025” U.S. stock indices closed in the red last week, with the Dow Jones down 2.51% and the S&P 500 losing 1.66%.
