TRADING STRATEGY TEST: THREE LEGS, ONE QUESTION
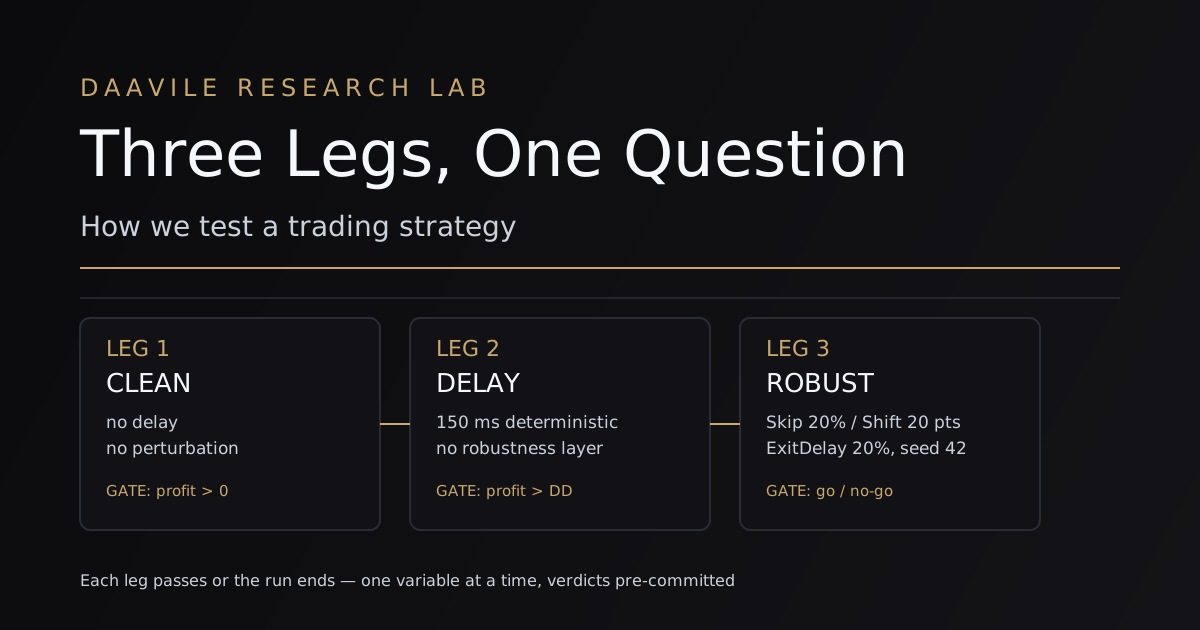
We deleted 264 test rows because one leg quietly ran the wrong experiment. The three-leg ladder replaced that guesswork: a clean baseline, a fixed 150 ms delay, and a robustness run, each with a gate that has an address.
 DAAVILE Research Lab
November 14, 2026
10 min
Article
We deleted an entire test wave once. 264 rows, all clean on the surface: normal gradients, recorded verdicts, a database that looked exactly like finished work. Every row answered the wrong question, because one leg ran the plain configuration under clean execution and quietly reproduced the baseline instead of testing robustness.
That failure is why this ladder has its current shape. A trading strategy test earns trust only when it separates the edge from the conditions that flatter it, so ours runs three legs: a clean baseline, a fixed 150 ms delay, and a measured robustness run. Each leg asks one question. When something fails, the failure has an address instead of hiding inside a pile of averages.
The stake is money, not adjectives. A strategy that works only with perfect fills can look excellent in a spreadsheet and fall apart the moment it meets a live order book. We want numbers that survive the ideal case, the deployment case, and a deliberately wrong market.
#Three legs, one question each
The ladder works because each leg changes one thing. P1 removes delay and perturbation. P2 keeps the strategy unchanged and adds the same 150 ms delay every time. P3 keeps execution clean and changes the market inputs instead.
| Leg | Condition | Question |
|---|---|---|
| P1 | Clean baseline | Does an edge exist at all? |
| P2 | Fixed 150 ms delay | Does it survive deployment latency? |
| P3 | Skip 20 / Shift 20 / ExitDelay 20, seed 42 | Does it survive a slightly wrong market? |
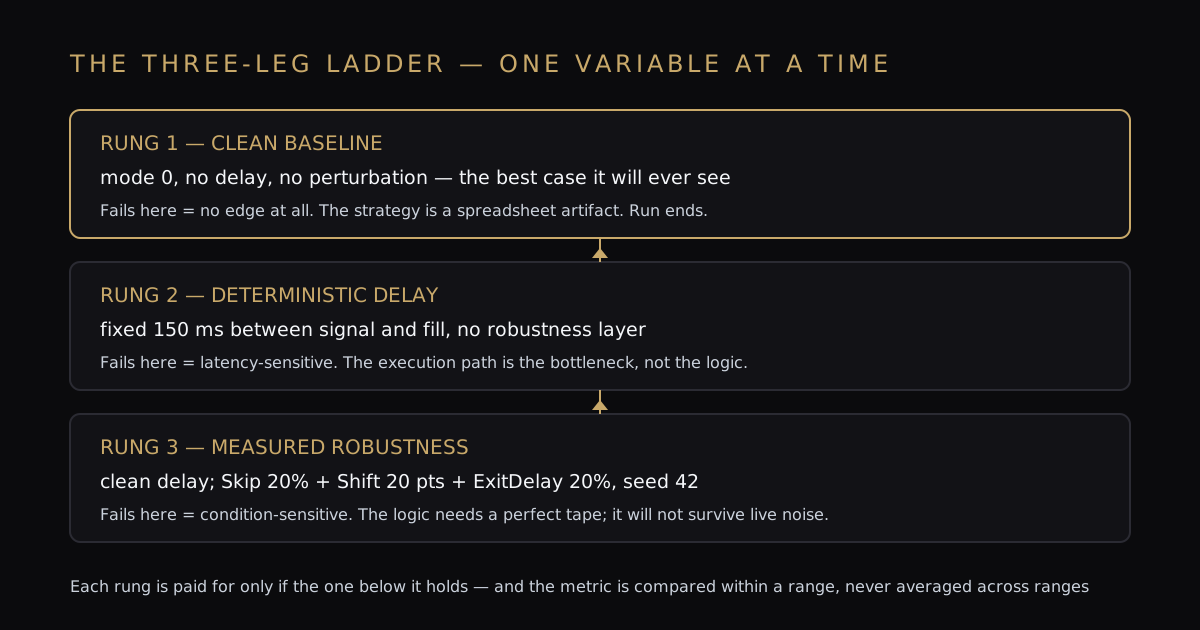
The order is also an economy. There is no point paying for a delayed or perturbed run when the strategy cannot make money in the clean case, so we start with the cheapest question and move down only when the first answer earns the next test.
The separation keeps the accounting straight, too. A range is one period of time: a start date and an end date and nothing else. A cell is one range under one phase, so P1, P2, and P3 results never blend into one score.
#The clean baseline sets the reference row
P1 is deliberately unrealistic. The strategy runs with no delay and no robustness perturbation in the tester's default execution mode, signals fill instantly at the mid price, and the leg gives us the upper bound everything else gets measured against.
The first gate is simple: the clean leg must produce positive profit. If it cannot, there is no edge to test under harder conditions. A pass here earns permission to keep going; it is not a final score.
| P1 proves | P1 cannot prove |
|---|---|
| The logic fires and the arithmetic works | That the result survives a slow fill |
| Positive profit is possible | That the profit is real rather than a fill-model artifact |
| The strategy direction makes sense | Anything about deployment, slippage, or spread cost |
P1 also works as a regression check. It has no variables, so it should stay still when nobody has touched the instrument, the tape, the contract, or the tester session. A moved clean result is the cheapest alarm we have: something drifted, and every later number should be read as a deviation from this row.
That is why we never call P1 a score. It is the reference from which the latency tax and the robustness loss are measured. A strategy that earns a large clean profit and loses almost all of it after 150 ms is fragile at the first millisecond, not at the tail.
#A fixed 150 ms delay exposes the latency tax
P2 measures the price of hesitation. Every order that filled instantly in P1 now fills 150 ms later, at whatever price the market reached in the meantime. Nothing else changes, which turns the gap between the two rows into a measurement instead of a guess.
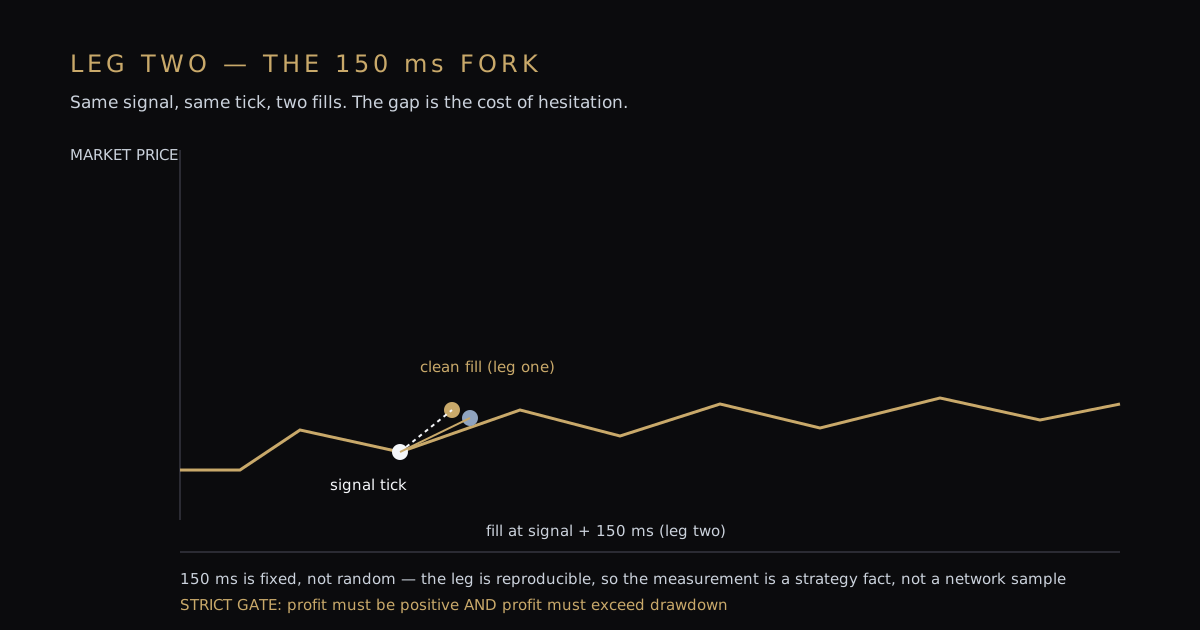
The delay is fixed on purpose. Run the leg twice and the same trades should land to the cent. A random delay would describe a distribution of network conditions; this leg describes the strategy's response to one repeatable deployment assumption.
The verdict has two parts: profit must stay positive, and profit must exceed drawdown. A barely positive result leaves no room for real execution, which is usually worse than the uniform 150 ms lag we just measured.
P2 is where an attractive curve starts to look fragile. A small edge can stay positive while drawdown rises faster than profit, and a gate that compared only one of the two numbers would celebrate the curve and miss the fragility. That is why the gate reads both.
The fixed point sits inside a wider sequence. Our four-gate latency ladder shows how this single delay check fits into a broader sequence of delay gates. The point here is narrower: the same delay must be applied every time, or the comparison is not repeatable.
#Robustness perturbs the market, not execution
P3 asks whether the edge can earn money in a slightly wrong world. Execution stays clean (no delay), but the market inputs take the RobustLab treatment: Skip 20 / Shift 20 / ExitDelay 20 with seed 42. Those settings make the perturbation repeatable and force the strategy to work without perfect inputs.
| RobustLab setting | Failure it probes |
|---|---|
| Skip 20% of ticks | A thin or intermittent tape hides entries |
| Shift 20 points | Entry prices drift and cost arrives as slippage |
| ExitDelay 20% | Orders leave later and exits become worse |
| Seed 42 | The same perturbation returns on every run |
The three changes cover different failure shapes. Skipping ticks can remove a signal the strategy thought it saw. Shifting points can turn a quoted entry into a worse fill. Holding exits longer can damage the exit logic. Together they map to four failure hypotheses: fill cost, missing entries, exit quality, and spread squeeze. The fixed seed keeps those effects comparable from one run to the next.
One honesty clause keeps P3 from manufacturing confidence. In our tester, skip and exit delay reliably bind; the price-shift and noise-style axes are currently vacuous there. Where a knob does nothing, we record "not measured here," never "passed." A gate that counts an inert setting as evidence is worse than no gate.
We can say that skip and exit delay changed the result. We cannot claim that a shift or noise knob proved anything if the tester never applied it. An inert control is evidence about the tester, not about the strategy.
#The wave we deleted: robustness that tested nothing
The worst failure in this kind of testing is a leg that runs the wrong experiment without erroring. P3 needs the perturbed configuration. Run the plain configuration used by P1 and P2 under clean execution and the result is a duplicate of P1: to the cent, trade for trade, not a rough approximation.
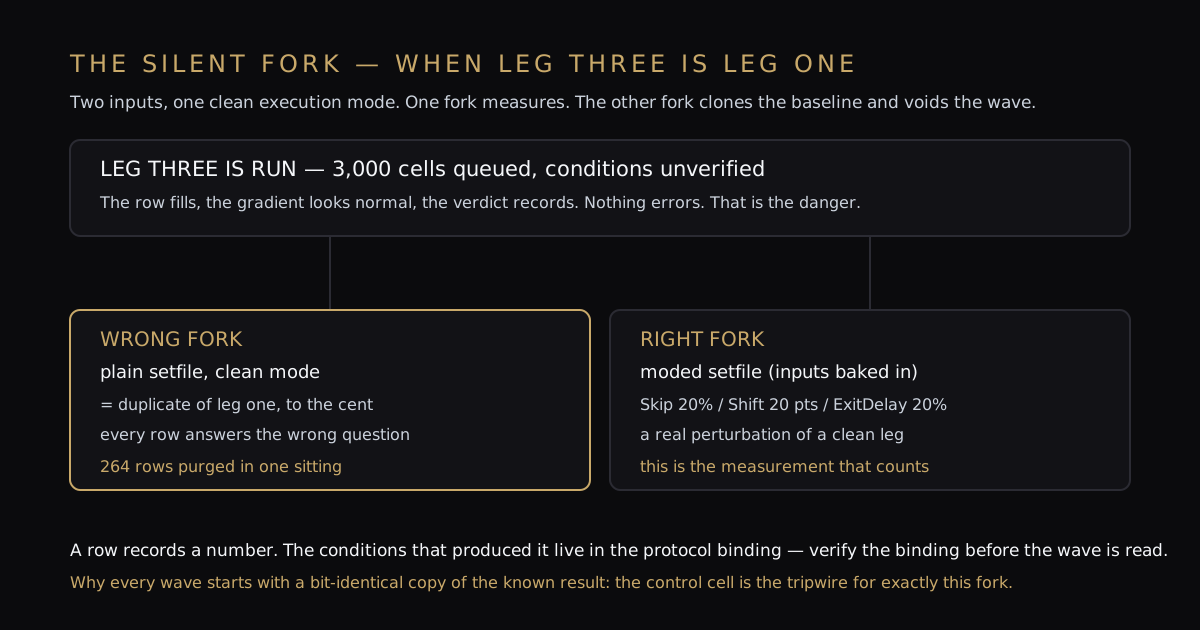
We purged 264 rows because this fork had voided one wave. The rows looked clean. Gradients were normal, verdicts were recorded, the database was full. Every row answered the wrong question, so their tidy appearance meant nothing.
The database cannot protect us from a bad binding. A row stores a number; the conditions live in the protocol: the configuration, the phase, the execution mode. We now verify those conditions before reading the wave, and our account of the deleted wave records the failure in full.
A known result must also return bit-for-bit before a wave starts. Our bit-identical control catches drift in the instrument or the runner before new results can inherit it. This is not extra polish. It is the first gate.
Verification is cheap compared with explaining a void wave later. We check the phase identity, the setfile binding, the execution mode, and the expected count before we read profit. A mismatch stops the wave at the door.
#What the code enforces today
We judge a process by what it checks, not by how confidently it describes itself. The current protocol covers structure, binding, immutability, and the terminal journal. Several performance gates are still written but not wired, so we publish both states.
| Written in the protocol | Enforced in code today |
|---|---|
| Each leg must conclude 500 ranges | No comparison between a lane's actual count and the expected count |
| G1–G4 latency gates with numeric thresholds | No gate object, threshold, or evaluation |
| Stage one gates stage two | Stages are parsed and drawn, but they do not gate execution |
| P2 runs at 150 ms and P3 carries RobustLab | The legs can run clean unless the structured blocks are present |
There are 0 numeric latency-gate thresholds enforced in code today. That does not erase the protocol; it changes who owns the check. A reviewer still compares the conditions and verdicts by hand, and we would rather say that plainly than call an unwired rule automatic.
The code does enforce several structural boundaries. A phase needs a valid identifier, deterministic flag, execution mode, and expected count; unknown keys are refused rather than quietly dropped. A run names exactly one protocol, a phase database is never overwritten, and the terminal's own journal must contain the passed token before registration.
Results also stay inside the correct range. We compute expectation per range and compare cells within the same range and phase. Averaging across ranges could let one smooth period hide a blown one, which would turn a visible failure into a pleasant headline.
#What we took from it
The ladder earns its keep because every failure has an owner. Running it, and then letting one wave go wrong, taught us three things that now shape how every result gets read.
- P1, P2, and P3 ask different questions: does an edge exist, what does 150 ms of latency cost, and does the edge survive a slightly wrong market.
- Conditions are verified before rows are read. Phase, configuration, and execution mode must match, because a matching number is not evidence on its own.
- A written gate is not an enforced gate. The gap goes on the review list, not into a marketing sentence.
None of this turns the ladder into a magic score. It makes the score narrower and more honest: three bounded questions, visible assumptions, and any gap between the written protocol and the code treated as work still waiting to be done.
Every accepted result carries its evidence. Our DAAVILEFX research dashboard shows the phases, verdicts, and raw deal streams run by run, and the published DAAVILEFX results list what cleared the process.
#Questions we get asked
#What are the three legs of the trading strategy test?
The first leg is a clean baseline, the second adds a deterministic 150 ms delay, and the third perturbs the market while keeping execution clean. Each leg asks a different question about the same strategy.
#Why does P3 need a different setfile?
P3 must carry the RobustLab inputs: Skip 20 / Shift 20 / ExitDelay 20 and seed 42. A plain setfile under clean execution reproduces P1 instead of measuring robustness.
#What should I check before trusting a wave?
Check the protocol binding, phase, setfile, and execution mode before reading the rows. The declared 500 ranges is still checked by hand because code does not compare it with the lane count.
#Is the three-leg ladder fully automated?
Not yet. There are 0 numeric latency-gate thresholds enforced in code today, even though the protocol names G1–G4. The written rules remain part of our manual review.
#Why do you compare results within a range?
A range is one period of time: a start date and an end date. A cell is one range under one phase. Comparing within that boundary stops one smooth period from hiding a blown one.